Texera Documentation
Welcome to the Texera Documentation Portal! This is your central hub for understanding, deploying, and contributing to the Texera platform.
Texera is an open-source data analytics and workflow management system. Use the sections below to find what you’re looking for.
New to Texera? Start here to set up your environment, install dependencies, and explore deployment options (Docker, AWS, GCP, Kubernetes, or Single Node).
Learn by doing. Explore step-by-step guides on how to use the UI, create datasets, manage workflows, and operate advanced features like Python UDFs and LLM integrations.
Deep dive into the theoretical framework behind Texera. Learn about Operators, Workflows, scalable execution, and how the core architecture hums under the hood.
Want to build out Texera? Find resources on setting up a local microservice development environment, writing Java or Python operators, navigating making contributions, and understanding our code standards.
Explore reference materials, past GUI screenshots, example workflows, and API specifications.
Don’t know where to begin? Head over to the Overview to read the pitch on why you should use Texera, who it’s built for, and how the architecture works at a high level.
1 - Overview
High-level overview of the Texera architecture, core concepts, and use cases.
Texera is an open-source system that supports collaborative data science at scale using Web-based workflows.
Texera combines powerful backend dataflow execution with an intuitive, drag-and-drop web interface. It allows users to build, execute, and share complex data workflows seamlessly across teams without worrying about the underlying computing infrastructure.
🏗️ Architecture: How it Works
At its core, Texera acts as a bridge between a highly accessible frontend and a scalable distributed computing backend.
- Web-Based Interface (Frontend): A rich GUI running directly in your browser. It allows users to construct data processing pipelines by dragging and dropping blocks on a canvas. No installation is required on client machines.
- Distributed Engine (Backend): When a workflow is submitted, the Texera engine compiles the graphical representation into an optimized, distributed execution plan. It then spins up computing units to process massive datasets in parallel.
- Storage Integration: Texera integrates smoothly with modern data lake and storage technologies (like LakeFS and MinIO) to persistently log runs and save datasets securely.
🧩 Core Concepts
To use Texera effectively, familiarize yourself with these foundational terms:
- Operators: The fundamental building blocks of a workflow. Each operator represents a single operation—such as filtering data, joining tables, training a machine learning model, or running a custom Python script. Operators have input and output ports to flow data seamlessly between them.
- Workflows: A Directed Acyclic Graph (DAG) constructed out of linked operators. Workflows represent fully end-to-end data pipelines.
- Datasets: Structured or semi-structured data sources uploaded to or generated by Texera. You can drag datasets directly into your workflow to begin processing them.
🎯 Use Cases & Target Audience
Texera bridges the gap between different technical proficiencies, making it ideal for teams to collaborate:
- Data Scientists: Quickly prototype data transformations, run machine learning algorithms, and visualize outputs without having to manage Spark or Kubernetes configurations manually.
- Domain Experts & Analysts: Utilize pre-built advanced analytics operators through an easy-to-learn visual interface, skipping the complex coding traditionally required for Big Data tasks.
- Software Engineers: Rapidly iterate and contribute back to the system by writing modular Java/Scala natively or injecting custom Python UDFs (User Defined Functions) directly into the execution graph.
Texera enables you to move from prototype to production data pipelines seamlessly.
2 - Getting Started
Quick start guide for running Texera and accessing it through the browser.
This section helps you quickly configure and launch Texera, and access the user interface.
Launch Texera
To begin, please follow our Installation Guide to set up Texera for your environment.
Once Texera is installed and running, open your web browser and navigate to its local URL:
2.1 - Install Texera
To install Texera, you may choose one of the two supported architectures depending on your needs:
2.2 - Installing Apache Texera using Docker
This document describes how to set up and run Texera on a single machine using “Docker Compose”.
Prerequisites
Before starting, make sure your computer meets the following requirements:
| Resource Type | Minimum | Recommended |
|---|
| CPU Cores | 2 | 8 |
| Memory | 4GB | 16GB |
| Disk Space | 20GB | 50GB |
You also need to install and launch Docker Desktop on your computer. Choose the right installation link for your computer:
After installing and launching Docker Desktop, verify that Docker and Docker Compose are available by running the following commands from the command line:
docker --version
docker compose version
You should see output messages like the following (your versions may be different):
$ docker --version
Docker version 27.5.1, build 9f9e405
$ docker compose version
Docker Compose version v2.23.0-desktop.1
By default, Texera services require ports 8080 and 9000 to be free. If either port is already in use, the services will fail to start.
On macOS or Linux, run the following commands to check:
lsof -i :8080
lsof -i :9000
If either command produces output, that port is occupied by another process. You will need to either stop that process or change Texera’s port configuration. See Advanced Settings > Run Texera on other ports for instructions.
Download Texera
Download the docker compose tarball and extract it.
Launch Texera
Enter the extracted directory and run the following command to start Texera:
docker compose --profile examples up
This command will start docker containers that host the Texera services, and pre-create two example workflows and datasets.
If you don’t want to have these examples pre-created, run the following command instead:
If you see the error message like unable to get image 'nginx:alpine': Cannot connect to the Docker daemon at unix:///Users/kunwoopark/.docker/run/docker.sock. Is the docker daemon running?, please make sure Docker Desktop is installed and running
When you start Texera for the first time, it will take around 5 minutes to download needed images.
The system should be ready around 1.5 minutes. After seeing the following startup message:
...
=========================================
  Texera has started successfully!
  Access at: http://localhost:8080
=========================================
...
you can open the browser and navigate to the URL shown in the message.
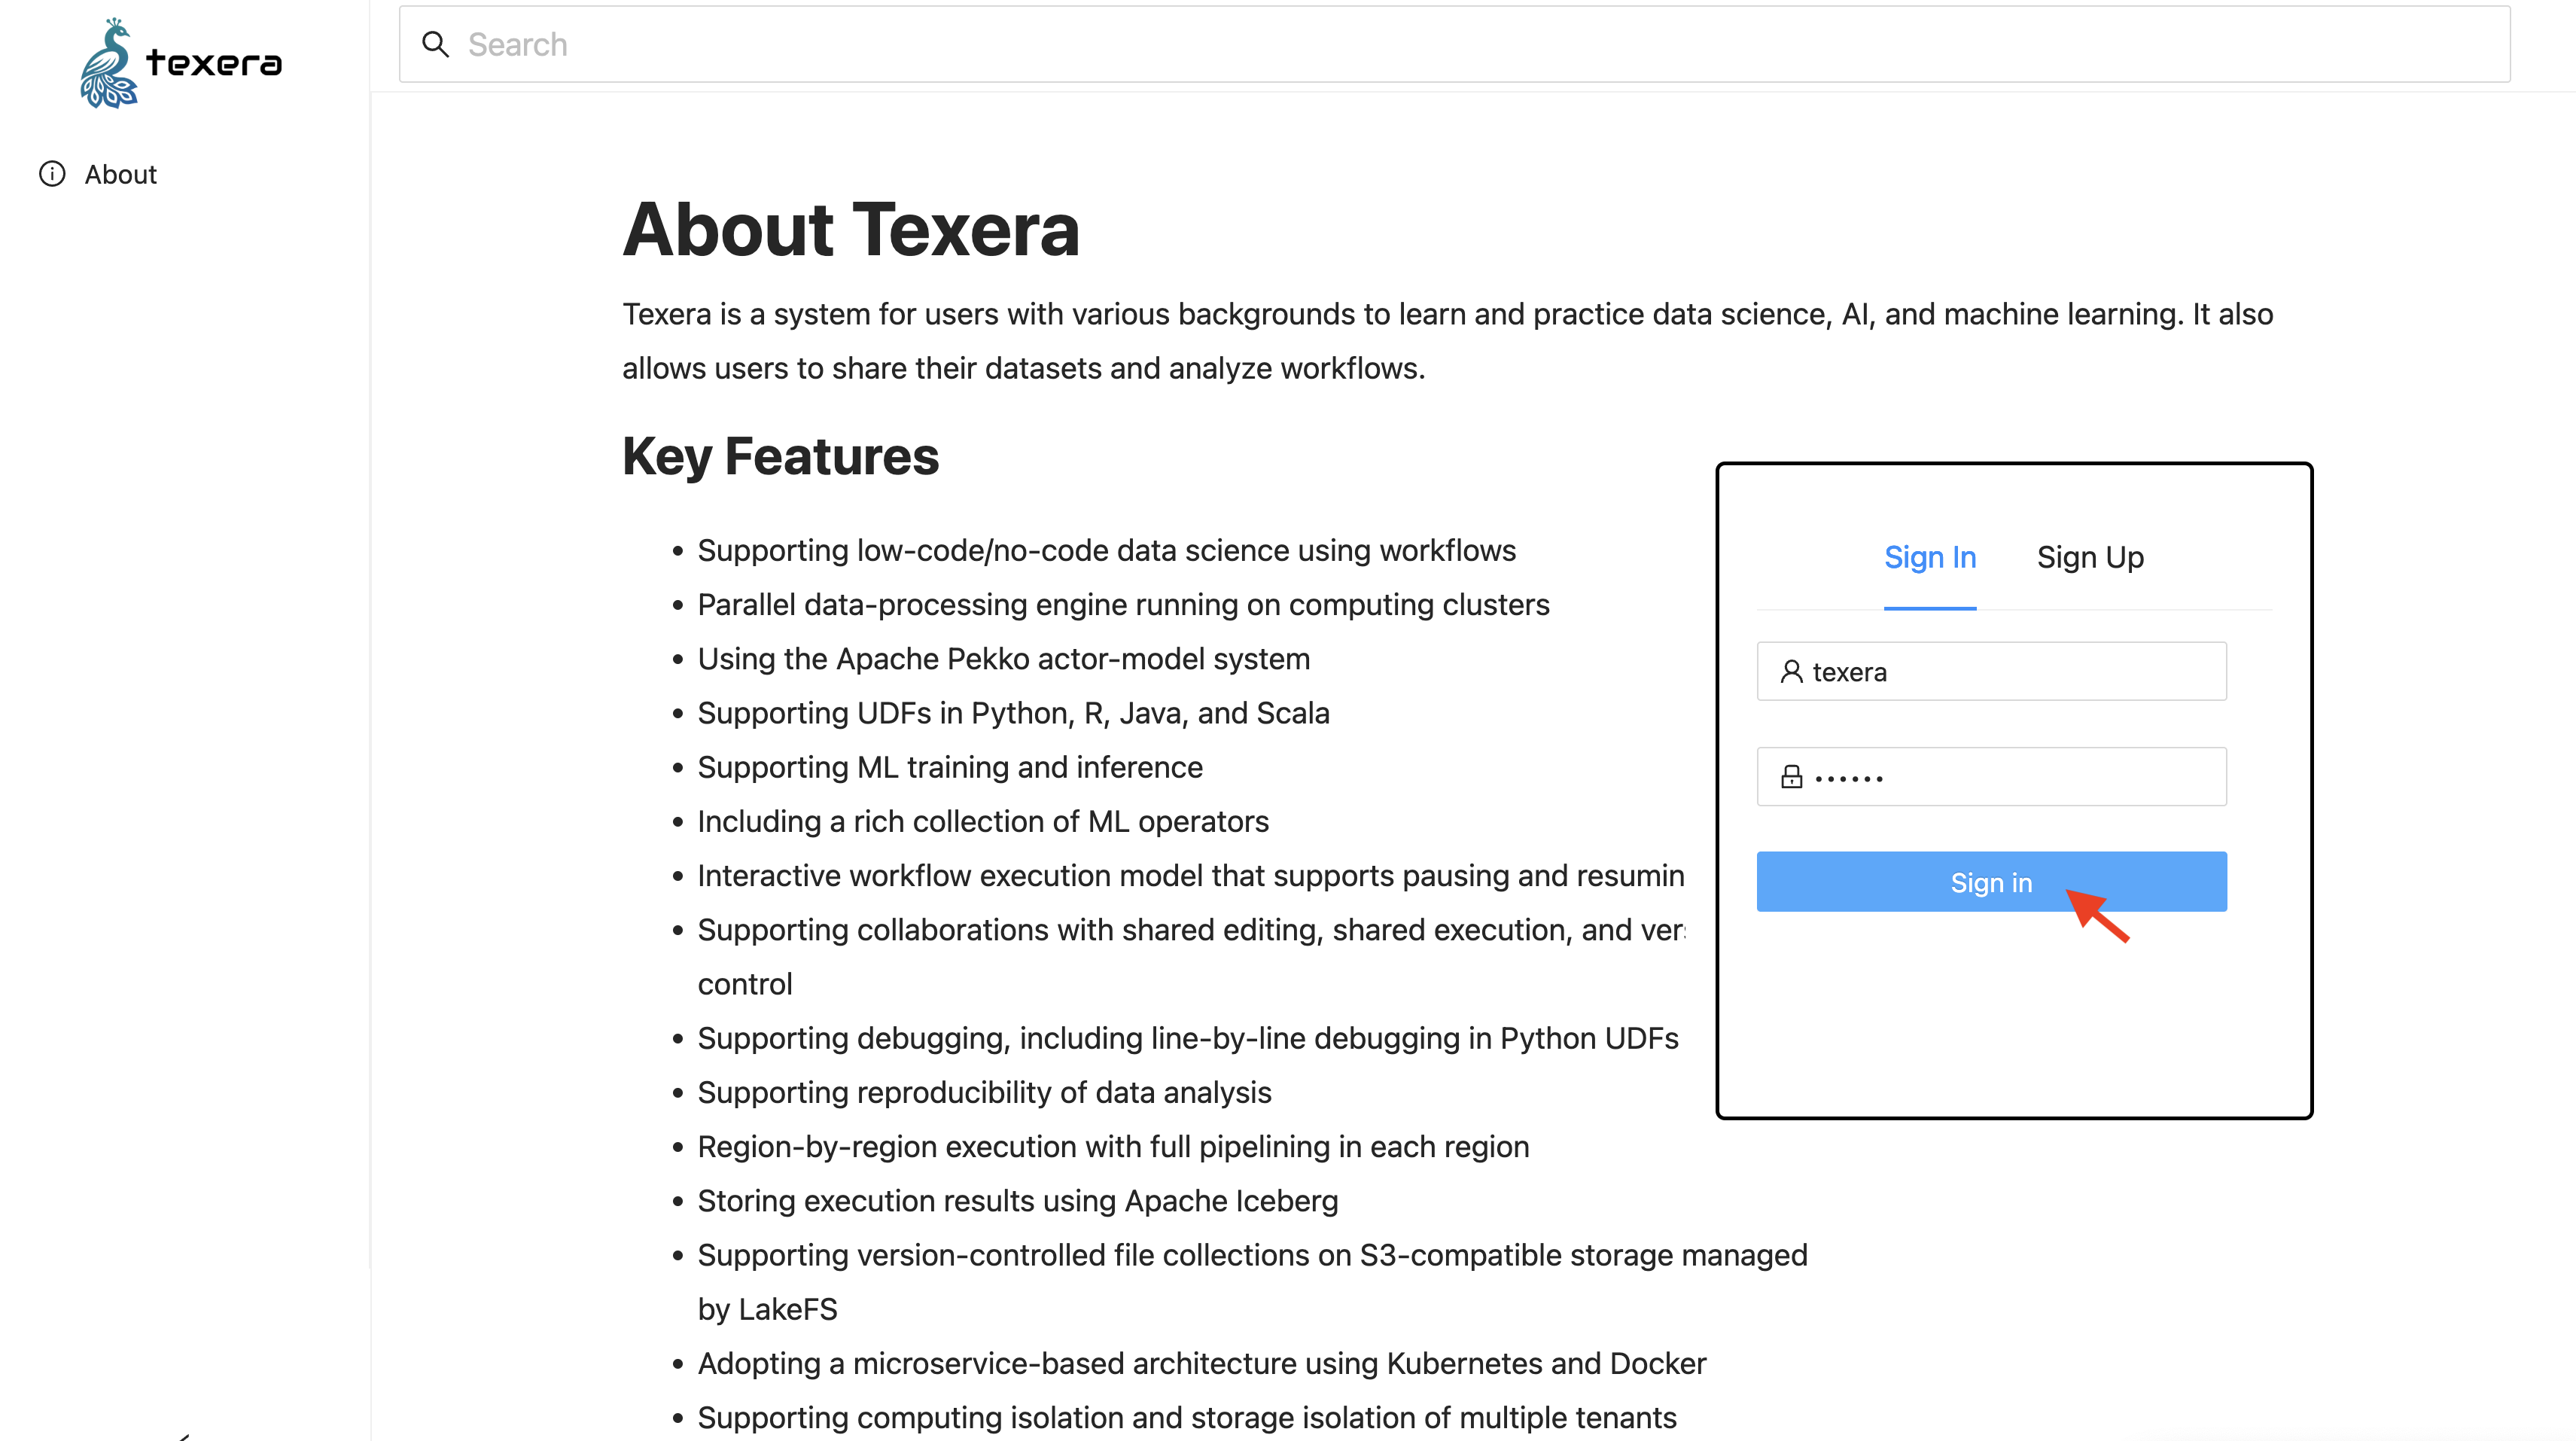
Input the default account texera with password texera, and then click on the Sign In button to login:
Stop, Restart, and Uninstall Texera
Stop
Press Ctrl+C in the terminal to stop Texera.
If you already closed the terminal, you can go to the installation folder and run:
docker compose --profile examples stop
to stop Texera.
Restart
Same as the way you launch Texera.
Uninstall
To remove Texera and all its data, go to the installation folder and run:
docker compose --profile examples down -v
⚠️ Warning: This will permanently delete all the data used by Texera.
Enable the Texera Agent
The Texera agent is powered by a large language model (LLM). By default, Texera uses Claude Haiku 4.5 as the LLM and queries it through LiteLLM. Without an API key, the Texera agent panel still appears but model calls will fail with a provider auth error.
To enable it:
- Stop Texera if it is already running.
- Get an API key for the LLM. Since Claude Haiku 4.5 is enabled by default, you need an Anthropic API key.
- Export the key and restart Texera:
export ANTHROPIC_API_KEY=sk-ant-...
docker compose --profile examples up
Once Texera is up, create a new workflow and open the Texera agent panel at the bottom right. Type a task like:
For /texera/popular-movies-of-imdb/v1/TMDb_updated.csv, visualize the top 10 most-voted movies.
To switch providers or add more LLMs, see Add more LLMs or providers.
Advanced Settings
Before making any of the changes below, please stop Texera first. Once you finish the changes, restart Texera to apply them.
All changes below are to the .env file in the installation folder, unless otherwise noted.
Run Texera on other ports
By default, Texera uses:
- Port 8080 for its web service
- Port 9000 for its MinIO storage service
To change these ports, open the .env file and update the corresponding variables:
- For the web service port (8080): change
TEXERA_PORT=8080 to your desired port, e.g., TEXERA_PORT=8081. - For the MinIO port (9000): change
MINIO_PORT=9000 to your desired port, e.g., MINIO_PORT=9001.
Change the locations of Texera data
By default, Docker manages Texera’s data locations. To change them to your own locations:
- Find the
persistent volumes section. For each data volume you want to specify, add the following configuration:
   volume_name:
     driver: local
     driver_opts:
       type: none
       o: bind
       device: /path/to/your/local/folder
For example, to change the folder of storing workflow_result_data to /Users/johndoe/texera/data, add the following:
   workflow_result_data:
     driver: local
     driver_opts:
       type: none
       o: bind
       device: /Users/johndoe/texera/data
If you already launched texera and want to change the data locations, existing data volumes need to be recreated and override in the next boot-up, i.e. select y when running docker compose up again:
$ docker compose up
? Volume "texera-single-node-release-1-1-0_workflow_result_data" exists but doesn't match configuration in compose file. Recreate (data will be lost)? (y/N)
y // answer y to this prompt
Add more LLMs or providers
Only Claude Haiku 4.5 is enabled by default. To add more LLMs, open litellm-config.yaml in the installation folder and append entries under model_list. Each entry follows this shape:
  model_list:
    ...
+   - model_name: <name shown in Texera>
+     litellm_params:
+       model: <provider model id>
+       api_key: "os.environ/<API_KEY_ENV_VAR>"
For example, to add OpenAI’s GPT-5.2 and Google’s Gemini 2.5 Pro:
  model_list:
    ...
+   - model_name: gpt-5.2
+     litellm_params:
+       model: gpt-5.2
+       api_key: "os.environ/OPENAI_API_KEY"
+
+   - model_name: gemini-2.5-pro
+     litellm_params:
+       model: gemini/gemini-2.5-pro
+       api_key: "os.environ/GEMINI_API_KEY"
Make sure to set the corresponding API key environment variable when you launch Texera (see Enable the Texera Agent). Get keys from each provider’s console — for example, OpenAI or Google.
If your provider is not Anthropic, OpenAI, or Google, also pass its key into the LiteLLM container by editing docker-compose.yml:
  litellm:
    ...
    environment:
      ANTHROPIC_API_KEY: ${ANTHROPIC_API_KEY:-}
      OPENAI_API_KEY: ${OPENAI_API_KEY:-}
      GEMINI_API_KEY: ${GEMINI_API_KEY:-}
+     <NEW_API_KEY>: ${<NEW_API_KEY>:-}
For the full list of supported providers and model IDs, see the LiteLLM proxy config docs.
Troubleshooting
Port conflicts
If Texera fails to start, a common cause is that ports 8080 or 9000 are already in use by another application. Check which ports are occupied:
lsof -i :8080
lsof -i :9000
Stop the conflicting process, or change Texera’s ports following the instructions in Advanced Settings > Run Texera on other ports.
Volume conflicts
PostgreSQL only runs the database initialization scripts on first startup (when its data volume is empty). If you previously started Texera and then ran docker compose down (without -v), the data volume still exists. On the next docker compose up, the initialization is skipped, which can cause services like lakeFS to fail because their required databases were never created.
To resolve this, remove all existing volumes and start fresh:
docker compose --profile examples down -v
docker compose --profile examples up
⚠️ Warning: docker compose --profile examples down -v permanently deletes all Texera data.
2.3 - How to run Texera on local Kubernetes
This document explains how to run Texera on Kubernetes locally for development purposes.
1. Prerequisites
Before you begin, you will need a local Kubernetes cluster manager. We use Minikube in this instruction.
- Install Minikube.
- Start your cluster:
- Verify that your node is running. You should see
minikube in your node list when you run: - Install Helm.
- Install local path plugin:
kubectl apply -f https://raw.githubusercontent.com/rancher/local-path-provisioner/master/deploy/local-path-storage.yaml
2. Install Texera using Helm
All the necessary Kubernetes files are located in the bin/k8s directory of this repository.
- Navigate to the
bin directory: - Install the Texera Helm chart. This command will install all Texera services into a new
texera-dev namespace.helm install texera k8s --namespace texera-dev --create-namespace
Note: If you get an error about missing Helm dependencies, navigate to the k8s directory and run the dependency update command, then try the installation again:
cd k8s
helm dependency update
cd ..
helm install texera k8s --namespace texera-dev --create-namespace
3. Verify the Installation
Wait for the required deployments to be in the Running state. You can check their status by running:
kubectl get deployments -n texera-dev
The key deployments required to run Texera are:
texera-webservertexera-file-servicetexera-workflow-computing-unit-manager
4. Accessing the Texera UI
Once the deployments are running, you can access the Texera web interface.
Port-Forwarding (If Required)
By default, the UI should be available at http://localhost:30080.
If you get a “connection refused” error, you may need to manually forward the ingress port. Open a new terminal and run:
kubectl port-forward -n envoy-gateway-system service/$(kubectl get svc -n envoy-gateway-system -l gateway.envoyproxy.io/owning-gateway-name=texera-gateway -o jsonpath='{.items[0].metadata.name}') 30080:80
Login
Open http://localhost:30080 in your browser and log in using the default username and password.
5. Troubleshooting
File Upload Error
If you see an error when trying to upload a file to a dataset, you may need to forward the port for MinIO (our file storage service).
Run the following command in a new terminal:
kubectl port-forward -n texera-dev service/texera-minio 31000:9000
This maps the service’s port 9000 to your local port 31000.
Using Custom-Built Images
To test custom changes, you can update the bin/k8s/values.yaml file to use your own Docker images. After modifying the values.yaml file, upgrade the Helm release to apply the changes:
helm upgrade texera k8s --namespace texera-dev
6. Security Recommendation
For any deployment, especially in production, it’s crucial to apply the principle of least privilege to limit potential damage from a security vulnerability. While the OS user deploying the chart needs kubectl and helm permissions, a more critical concern is the user running the application inside the containers.
Run Containers as a Non-Root User
By default, many container images run as the root user. If an attacker exploits a vulnerability in an application (like the running code on computing unit), they would gain root privileges within the container, giving them full control to access or modify its contents and potentially attack other services.
To prevent this, you should configure the Kubernetes deployments to run the processes as a specific, unprivileged user.
The following is a sample template you can use:
spec:
  template:
    spec:
      securityContext:
        # Run as a non-root user (e.g., user 1001)
        runAsUser: 1001
        runAsGroup: 1001
        # Enforce that the container cannot run as root
        runAsNonRoot: true
        # Make the root filesystem read-only
        readOnlyRootFilesystem: true
      containers:
      - name: texera-webserver
        image: ...
2.4 - Access/Login to Texera
Instructions on how to install and set up Texera as a developer.
Guide to use Texera on your local machine or development environment.
Prerequisites
We assume you either went through
Texera should be up-and-running on your laptop before proceeding.
Note
Ensure Docker and Docker Compose are installed before building Texera.Access Texera through Browser
Enter Texera’s URL in your browser to access the interface.
By default, an admin account is pre-created:
| Username | Password |
|---|
texera | texera |
Input credentials and click the Sign in button to log in as the admin.
2.5 - Texera UI Overview
Explore Texera’s User Dashboard interface and its components.
Understand the layout and functionality of Texera’s User Dashboard.
User Dashboard
Once logged in, you should see the following page:
Navigation Bar
On the left sidebar, you can switch between different resource modules:
- Workflows — manage workflow projects.
- Datasets — upload and manage data files.
- Quota — check usage statistics and resource consumption.
- Admin — manage system users (visible only to admins).
Tip
Hover over the navigation icons to see quick tooltips for each section.3 - Concepts
Overview of the key ideas and components behind Texera. This section introduces core concepts that help users and contributors understand how Texera works.
This section explains the foundational concepts behind Texera — the ideas, architecture, and components that make up the platform.
Understanding Texera conceptually helps both users and contributors get the most out of the system.
For end users, it provides background on how workflows and operators interact to process data.
For contributors, it offers insight into the design principles and architecture that power Texera’s engine and user interface.
What’s in this section
The Concepts section introduces the core ideas that define Texera’s design and operation:
- Workflows: How users visually build and manage data pipelines.
- Operators: The modular units that perform data transformations.
- Execution Engine: The core component that executes workflows efficiently.
- Data Model: How Texera represents, stores, and streams data.
- Architecture: The high-level structure connecting frontend, backend, and execution layers.
Each page below explores one of these areas in more depth, explaining how Texera’s internal components work together to support flexible, scalable, and interactive data analytics.
When to read this section
If you’re new to Texera, start with the Overview page to understand what the platform does.
Then come here to learn how it works under the hood.
If you’re contributing to Texera or integrating it with other systems, the detailed concept pages — such as Engine, Operator Framework, and Architecture — will help you understand Texera’s internal design and extension points.
4 - Tutorials
Step-by-step guides for building workflows and applications with Texera.
This section provides complete, end-to-end tutorials that guide you through realistic Texera use cases — from building simple workflows to creating complex data analytics pipelines.
Texera tutorials help you learn by doing.
Each tutorial walks through a realistic workflow scenario, showing how to use Texera’s visual interface, operators, and execution engine to build and run data analytics applications.
🎯 What to Expect
The tutorials in this section will help you:
- Understand Texera’s workflow-based design step by step.
- Learn how to connect operators, configure parameters, and visualize results.
- Explore practical data use cases, such as text processing, joining datasets, and real-time analysis.
- Get comfortable with extending Texera by creating or modifying operators.
🧱 Structure
Each tutorial consists of:
- Goal Overview – what you’ll build and what problem it solves.
- Step-by-Step Instructions – detailed actions to complete the workflow.
- Key Takeaways – concepts and Texera features you’ll learn.
- Next Steps – related tutorials or examples to explore further.
🧭 Getting Started
If you’re new to Texera, start with the Getting Started guide to set up your local environment.
Once Texera is running, return here to begin working through the tutorials in order.
📚 Available Tutorials
This section will include multiple tutorials, such as:
- Building your first workflow
- Exploring data transformation operators
- Working with visualization tools
- Combining multiple datasets
- Extending Texera with custom operators
Each tutorial will include screenshots, sample data, and workflow files you can download and import into your Texera instance.
💡 Want to Contribute a Tutorial?
If you’ve built a useful workflow or want to help new users learn Texera, you can contribute your own tutorial:
- Create a Markdown page under
content/docs/tutorials/. - Include any relevant
.json workflow files or sample datasets. - Submit a pull request following our Contribution Guidelines.
Texera tutorials are designed to help you go from understanding concepts to building complete solutions — one workflow at a time.
4.1 - Guide for how to use Texera
Texera is an open-source system that supports collaborative data science at scale using Web-based workflows. This page includes instructions on how to install the system as a developer and do a simple workflow.
Prerequisites
We assume you either went through Installing Apache Texera using Docker, or the Guide for Texera Developers. And Texera is up-and-running on your laptop.
Access Texera through Browser
Enter Texera’s URL on your browser to access Texera.
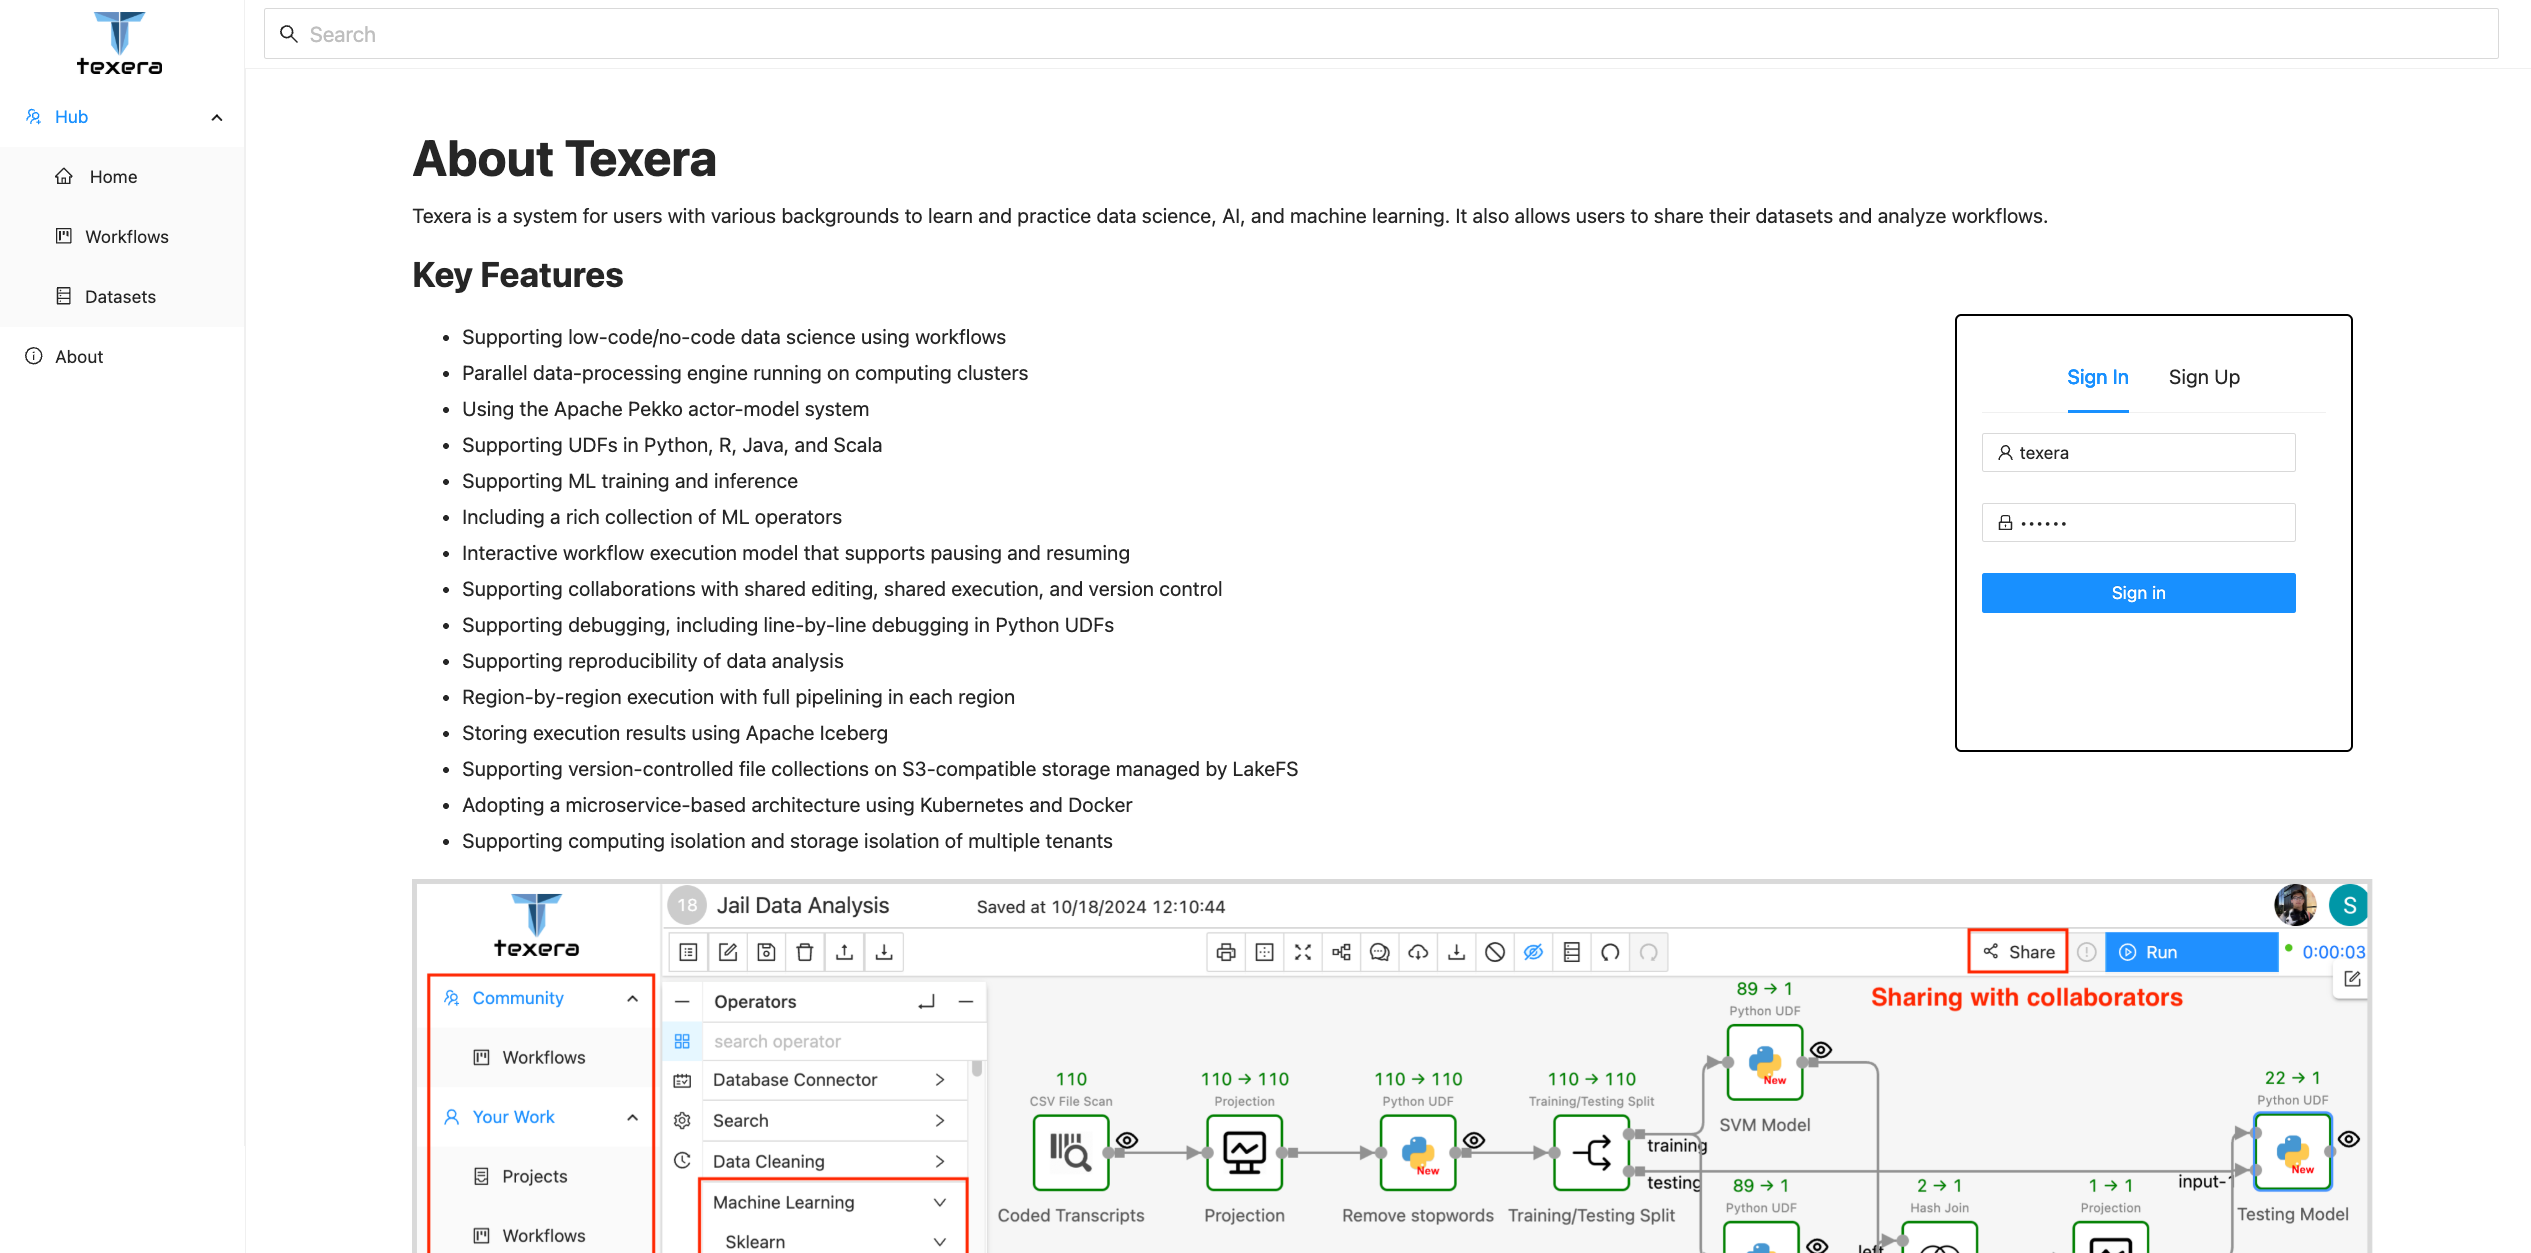
An admin account with username texera and password texera is pre-created by default. Input the username, password and click the Sign in button to login as the admin:
User Dashboard UI Overview
Once logged in, you should see the below page:
This is Texera’s dashboard page. On the left navigation bar, you can switch between different resource modules, including
Workflows for workflow managementDatasets for dataset managementQuota for checking the usage statisticsAdmin for managing users on the Texera system. This tab is only visible for system admins.
Workflow Workspace UI Overview
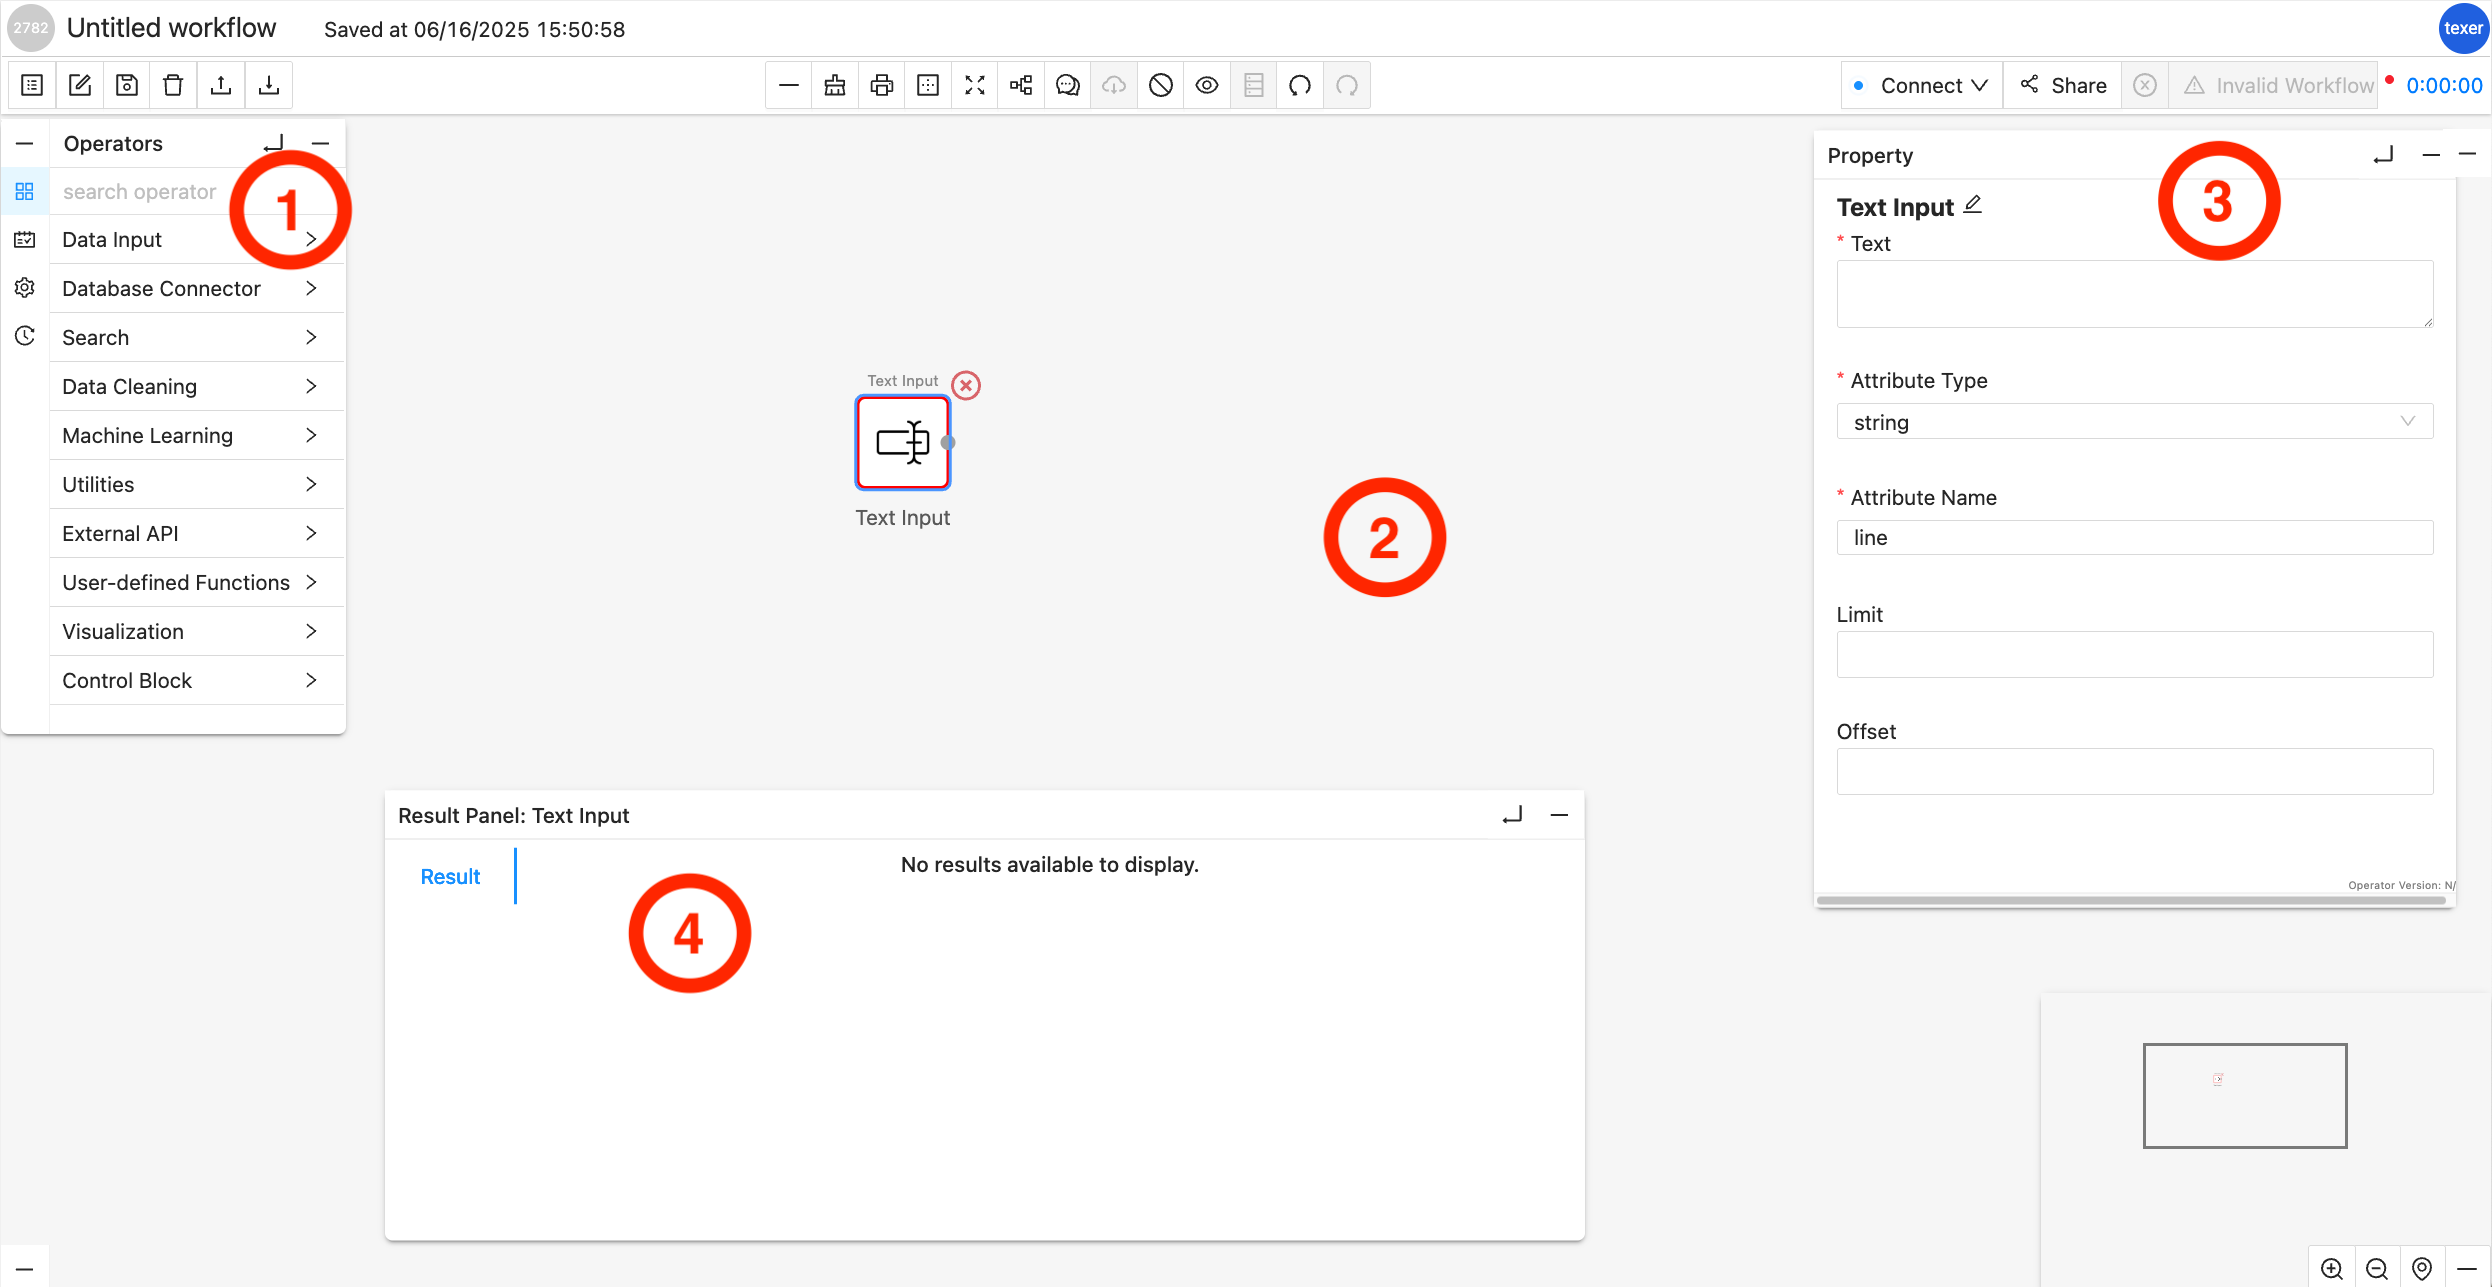
Operator Library/Menu:
It is separated into multiple dropdown menus based on the operator type, e.g., Source Operator, Search Operator, etc. You can drag and drop an operator from these dropdown menus onto the Workflow Canvas.
Workflow Canvas:
It is the main playground, where you can drag and drop Operators from the Operator Library onto it. Each operator is shown as a square box and connected with other operators with arrowed links which indicates the data flow.
Properties Editor Panel:
The panel will show up when you highlight a specific operator (by clicking on it) in the Workflow Canvas. You can customize the properties of the selected operator, for example, set the keyword for a filter. When the selected operator is configured correctly, a green ring will surround it; while a red ring usually indicates an error in configuration or connection to other operators.
Result Panel:
By default or when there is no result, it is hidden. You can click on the little UP arrow to expand this panel. When a workflow is finished running, the result panel will pop up with the data. You may slide up and down or left and right to view the data inside the panel.
4.2 - Create Dataset, upload data to it and use it in Workflow
This tutorial goes through the process of preparing data by creating dataset and creating a workflow to analyze data resided in the dataset using Texera.
More specifically, we are going to create a dataset named Sales Dataset which contains a file about the sales data of different types of merchandises for several countries. And the workflow will calculate the average sales per item type across different countries in Europe from the CountrySalesData.csv (Make sure the downloaded file is in .csv file extension). The sales data has been downloaded from eforexcel.com and has 100 rows of data.
We will first be creating a dataset and uploading the sales data to it. Then we will be creating a workflow on Texera Web UI to
- read the data from the file;
- filter the relevant data based on keywords;
- perform an aggregation.
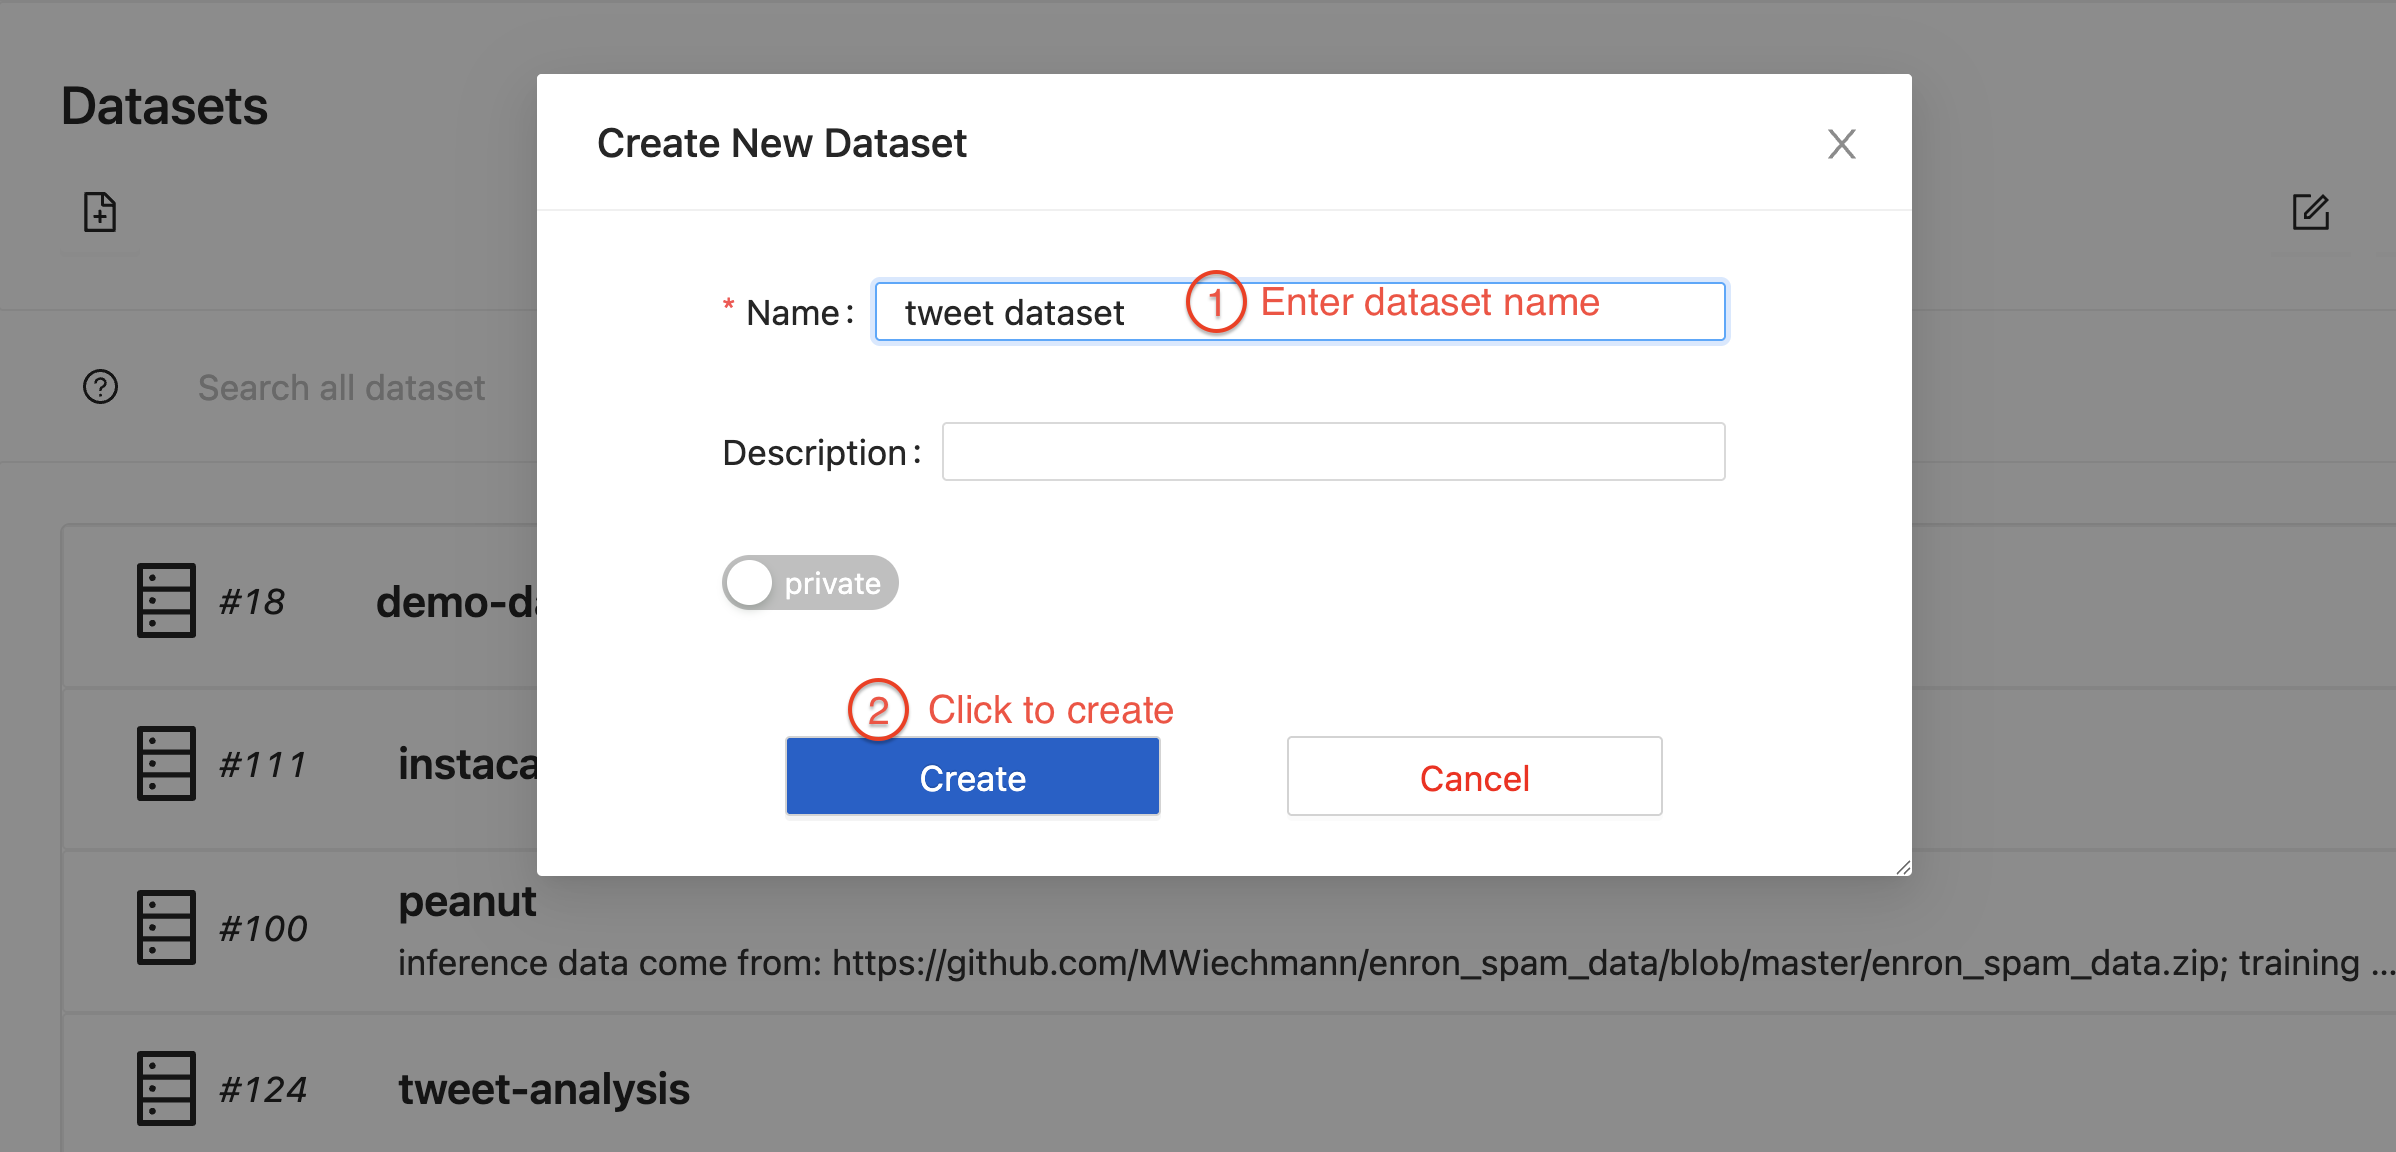
1. Upload data by creating a Dataset
- Go to the Dataset tab and click the
dataset creation icon to start creating the datasaet - Name the dataset as
Sales Dataset, drag and drop the CountrySalesData.csv to the file uploading area - Click
Create, the dataset we just created, along with the preview of CountrySalesData.csv is shown.
2. Read data in Workflow
- On the left panel, go to the
environment tab and click Add Dataset to add the Sales Dataset to current workflow. CountrySalesData.csv will be available to be previewed and loaded to the workflow.
 '
' - Drag and drop a
CSV File Scan operator. On the right panel, input the file name CountrySalesData.csv and select the path from the drop down menu - Run the workflow, you should be able to see the loaded sales data.
3. Add operators to analyze data
4.3 - Guide to Use a Python UDF
What is Python UDF
User-defined Functions (UDFs) provide a means to incorporate custom logic into Texera. Texera offers comprehensive Python UDF APIs, enabling users to accomplish various tasks. This guide will delve into the usage of UDFs, breaking down the process step by step.
UDF UI and Editor
The UDF operator offers the following interface, requiring the user to provide the following inputs: Python code, worker count, and output schema.
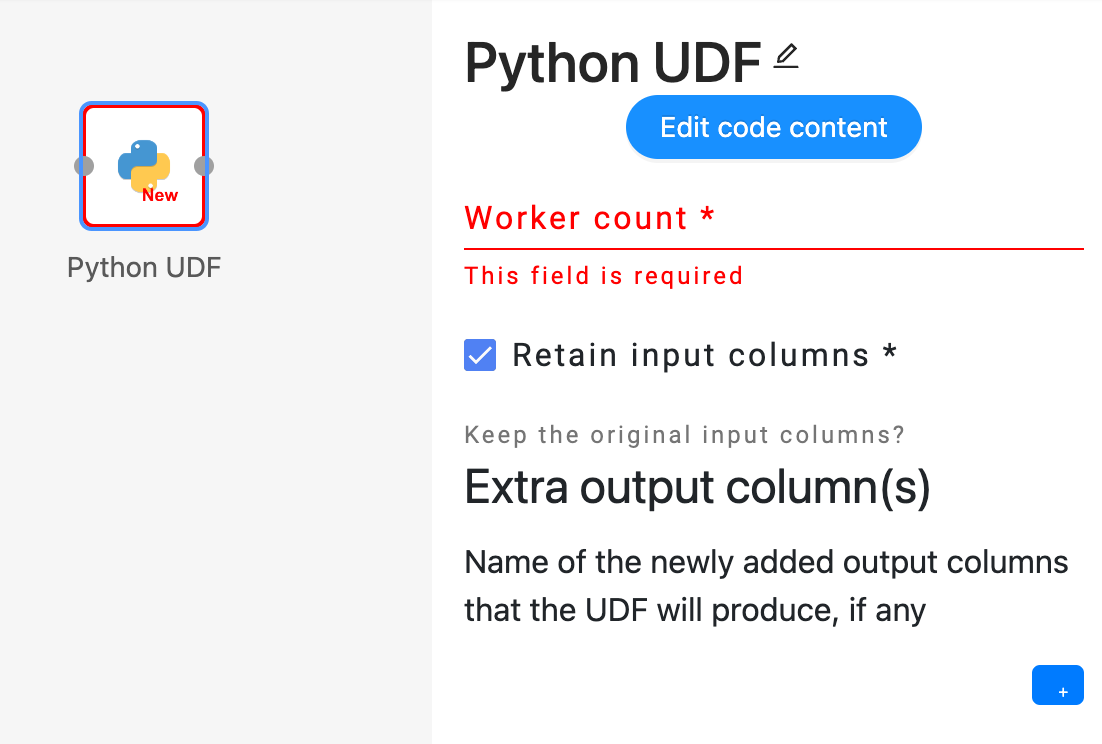
 Users can click on the “Edit code content” button to open the UDF code editor, where they can enter their custom Python code to define the desired operator.
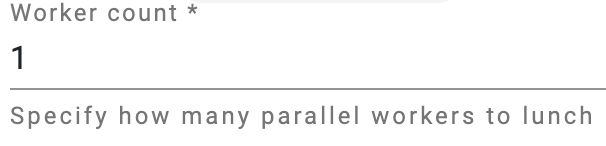 Users have the flexibility to adjust the parallelism of the UDF operator by modifying the number of workers. The engine will then create the corresponding number of workers to execute the same operator in parallel.
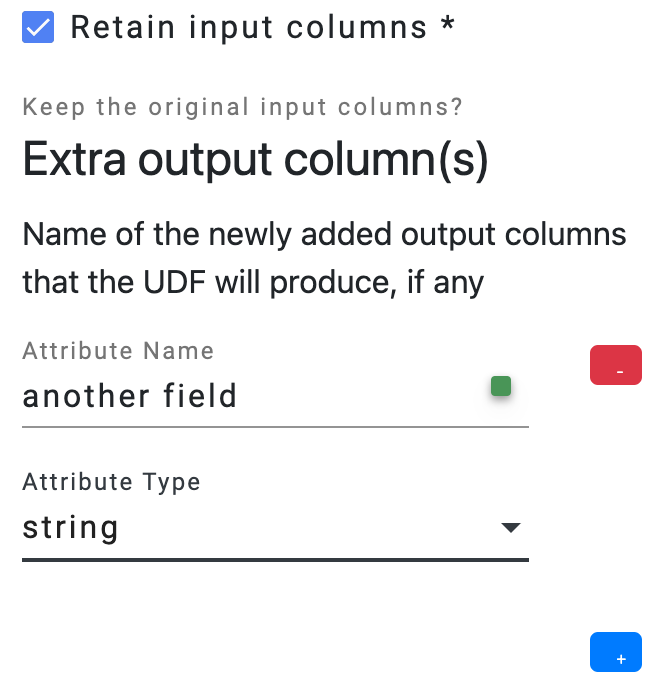 Users need to provide the output schema of the UDF operator, which describes the output data’s fields.
- The option
Retain input columns allows users to include the input schema as the foundation for the output schema. - The
Extra output column(s) list allows users to define additional fields that should be included in the output schema.
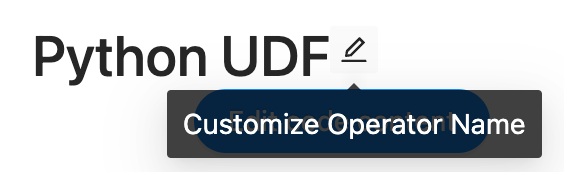 Optionally, users can click on the pencil icon located next to the operator name to make modifications to the name of the operator.
Operator Definition
Iterator-based operator
In Texera, all operators are implemented as iterators, including Python UDFs.
Concepturally, a defined operator is executed as:
operator = UDF() # initialize a UDF operator

... # some other initialization logic

# the main process loop
while input_stream.has_more():
    input_data = next_data()
    output_iterator = operator.process(input_data)
    for output_data in output_iterator:
        send(output_data)

... # some cleanup logic
Operator Life Cycle
The complete life cycle of a UDF operator consists of the following APIs:
open() -> None Open a context of the operator. Usually it can be used for loading/initiating some resources, such as a file, a model, or an API client. It will be invoked once per operator.process(data, port: int) -> Iterator[Optional[data]] Process an input data from the given port, returning an iterator of optional data as output. It will be invoked once for every unit of data.on_finish(port: int) -> Iterator[Optional[data]] Callback when one input port is exhausted, returning an iterator of optional data as output. It will be invoked once per port.close() -> None Close the context of the operator. It will be invoked once per operator.
Process Data APIs
There are three APIs to process the data in different units.
- Tuple API.
class ProcessTupleOperator(UDFOperatorV2):

    def process_tuple(self, tuple_: Tuple, port: int) -> Iterator[Optional[TupleLike]]:
        yield tuple_
Tuple API takes one input tuple from a port at a time. It returns an iterator of optional TupleLike instances. A TupleLike is any data structure that supports key-value pairs, such as pytexera.Tuple, dict, defaultdict, NamedTuple, etc.
Tuple API is useful for implementing functional operations which are applied to tuples one by one, such as map, reduce, and filter.
- Table API.
class ProcessTableOperator(UDFTableOperator):

    def process_table(self, table: Table, port: int) -> Iterator[Optional[TableLike]]:
        yield table
Table API consumes a Table at a time, which consists of all the tuples from a port. It returns an iterator of optional TableLike instances. A TableLike is a collection of TupleLike, and currently, we support pytexera.Table and pandas.DataFrame as a TableLike instance. More flexible types will be supported down the road.
Table API is useful for implementing blocking operations that will consume all the data from one port, such as join, sort, and machine learning training.
- Batch API.
class ProcessBatchOperator(UDFBatchOperator):

    BATCH_SIZE = 10

    def process_batch(self, batch: Batch, port: int) -> Iterator[Optional[BatchLike]]:
        yield batch
Batch API consumes a batch of tuples at a time. Similar to Table, a Batch is also a collection of Tuples; however, its size is defined by the BATCH_SIZE, and one port can have multiple batches. It returns an iterator of optional BatchLike instances. A BatchLike is a collection of TupleLike, and currently, we support pytexera.Batch and pandas.DataFrame as a BatchLike instance. More flexible types will be supported down the road.
The Batch API serves as a hybrid API combining the features of both the Tuple and Table APIs. It is particularly valuable for striking a balance between time and space considerations, offering a trade-off that optimizes efficiency.
All three APIs can return an empty iterator by yield None.
Schemas
A UDF has an input Schema and an output Schema. The input schema is determined by the upstream operator’s output schema and the engine will make sure the input data (tuple, table, or batch) matches the input schema. On the other hand, users are required to define the output schema of the UDF, and it is the user’s responsibility to make sure the data output from the UDF matches the defined output schema.
Ports
Input ports:
A UDF can take zero, one or multiple input ports, different ports can have different input schemas. Each port can take in multiple links, as long as they share the same schema.
Output ports:
Currently, a UDF can only have exactly one output port. This means it cannot be used as a terminal operator (i.e., operator without output ports), or have more than one output port.
1-out UDF
This UDF has zero input port and one output port. It is considered as a source operator (operator that produces data without an upstream). It has a special API:
class GenerateOperator(UDFSourceOperator):

    @overrides
    def produce(self) -> Iterator[Union[TupleLike, TableLike, None]]:
        yield
This produce() API returns an iterator of TupleLike, TableLike, or simply None.
See Generator Operator for an example of 1-out UDF.
2-in UDF
This UDF has two input ports, namely model port and tuples port. The tuples port depends on the model port, which means that during the execution, the model port will execute first, and the tuples port will start after the model port consumes all its input data.
This dependency is particularly useful to implement machine learning inference operators, where a machine learning model is sent into the 2-in UDF through the model port, and becomes an operator state, then the tuples are coming in through the tuples port to be processed by the model.
An example of 2-in UDF:
class SVMClassifier(UDFOperatorV2):


    @overrides
    def process_tuple(self, tuple_: Tuple, port: int) -> Iterator[Optional[TupleLike]]:

        if port == 0: # models port
           self.model = tuple_['model']

        else: # tuples port
           tuple_['pred'] = self.model.predict(tuple_['text'])
           yield tuple_
Currently, in 2-in UDF, “Retain input columns” will retain only the tuples port’s input schema.
4.4 - Guide to enable the LLM‐based Texera agent
This guide explains how to enable the AI agent feature in Texera. For detailed explanation about this feature, see https://github.com/apache/texera/pull/4020.
Prerequisites
- Already know how to setup Texera
- Python 3.10+
- API key from a supported LLM provider (e.g., Anthropic, OpenAI)
Step 1: Install LiteLLM
Run command:
pip install 'litellm[proxy]'
Set your LLM provider API key as an environment variable:
For Anthropic (Claude):
export ANTHROPIC_API_KEY=<your-anthropic-api-key>
For OpenAI:
export OPENAI_API_KEY=<your-openai-api-key>
You can set multiple API keys if you want to use models from different providers.
Step 3: Start LiteLLM Service
Start the LiteLLM proxy using the provided configuration:
litellm --config bin/litellm-config.yaml
By default, LiteLLM runs on http://0.0.0.0:4000.
To customize available models, edit bin/litellm-config.yaml. See LiteLLM documentation for more options. Also see LiteLLM Model Configuration for supported providers and model formats.
Step 4: Enable agent in Configuration
Modify common/config/src/main/resources/gui.conf to enable the agent feature:
 gui {
   workflow-workspace {
     # ... other settings ...

     # whether AI agent feature is enabled
-    copilot-enabled = false
+    copilot-enabled = true
   }
 }
The AccessControlService acts as a gateway between the frontend and LiteLLM. If LiteLLM is running on a different host or port, modify common/config/src/main/resources/llm.conf:
 llm {
   # Base URL for LiteLLM service
-  base-url = "http://0.0.0.0:4000"
+  base-url = "http://your-litellm-host:4000"

   # Master key for LiteLLM authentication
-  master-key = ""
+  master-key = "your-master-key"
 }
Alternatively, set environment variables:
export LITELLM_BASE_URL=http://your-litellm-host:4000
export LITELLM_MASTER_KEY=your-master-key
Step 6: Start Texera Services
Start the all Texera micro services, including the AccessControlService.
Done!
After opening any workflow, you should now see a robot icon at the bottom right. Click on it will expand a panel with all the available models:
4.5 - Guide to launch Lakekeeper as the RESTCatalog Service for Texera's workflow result storage
This guide goes through the process of setting up Lakekeeper, which can be used as the REST Catalog service for Texera’s workflow result storage.
For more information of why using RESTCatalog, see Issue #4126.
Prerequisites
- OS: macOS or Linux
- Already know how to setup Texera
- A running PostgreSQL instance
- An accessible S3 Bucket Endpoint
- awscli needs to be installed
Step 1: Install Lakekeeper
On macOS / Linux, run
Verify the installation by running:
Alternatively, you can download a pre-built binary from the https://github.com/lakekeeper/lakekeeper/releases and place it on your $PATH.
Step 2: Create a Database for Lakekeeper in Postgres
Create a database using the SQL script in Texera’s repository:
psql -f sql/texera_lakekeeper.sql
Edit the User Configuration section at the top of bin/bootstrap-lakekeeper.sh.
First, set the PostgreSQL connection URLs used by Lakekeeper:
-LAKEKEEPER__PG_DATABASE_URL_READ=""
-LAKEKEEPER__PG_DATABASE_URL_WRITE=""
+LAKEKEEPER__PG_DATABASE_URL_READ="postgres://<user>:<urlencoded_password>@<host>:5432/texera_lakekeeper"
+LAKEKEEPER__PG_DATABASE_URL_WRITE="postgres://<user>:<urlencoded_password>@<host>:5432/texera_lakekeeper"
If you have customized storage-related values in common/config/src/main/resources/storage.conf (for example, the bucket name, S3 endpoint, or MinIO credentials), check the below environment variables in the script and modify their values accordingly:
  # Storage settings — must stay in sync with storage.conf
  # if needed, update the default values after `:-` to match storage.conf
STORAGE_ICEBERG_CATALOG_REST_URI="${STORAGE_ICEBERG_CATALOG_REST_URI:-http://localhost:8181/catalog}"
STORAGE_ICEBERG_CATALOG_REST_WAREHOUSE_NAME="${STORAGE_ICEBERG_CATALOG_REST_WAREHOUSE_NAME:-texera}"
STORAGE_ICEBERG_CATALOG_REST_REGION="${STORAGE_ICEBERG_CATALOG_REST_REGION:-us-west-2}"
STORAGE_ICEBERG_CATALOG_REST_S3_BUCKET="${STORAGE_ICEBERG_CATALOG_REST_S3_BUCKET:-texera-iceberg}"
STORAGE_S3_ENDPOINT="${STORAGE_S3_ENDPOINT:-http://localhost:9000}"
STORAGE_S3_AUTH_USERNAME="${STORAGE_S3_AUTH_USERNAME:-texera_minio}"
STORAGE_S3_AUTH_PASSWORD="${STORAGE_S3_AUTH_PASSWORD:-password}"
Step 4: Run the Bootstrap Script
Run the following script in Texera repo:
bash bin/bootstrap-lakekeeper.sh
The script will:
- Start Lakekeeper if it’s not already running (on http://localhost:8181)
- Bootstrap the Lakekeeper server (creates the default project)
- Create the texera-iceberg bucket in MinIO if it doesn’t exist
- Register the texera warehouse with Lakekeeper, pointing at that bucket
Step 5: Verify
Check that Lakekeeper is healthy by running:
curl http://localhost:8181/health
You should see a JSON response with "health":"ok".
Verify that the warehouse has been created by running:
curl http://localhost:8181/management/v1/warehouse
You should see a warehouse in the response.
Step 6: Switch Texera to use the REST catalog
To make Texera actually use the Lakekeeper REST catalog you just set up, edit common/config/src/main/resources/storage.conf:
  storage {
      iceberg {
          catalog {
-             type = postgres
+             type = rest
              ...
          }
      }
  }
Done!
Lakekeeper is now your service of managing Iceberg RESTCatalog. Texera workflows that produce Iceberg results will write to the S3 bucket via the Iceberg RESTCatalog.
4.6 - Migrate a Jupyter Notebook to a Texera Workflow
This document provides guidelines on how to migrate a Jupyter notebook to a Texera workflow.
1. Overview
Jupyter Notebook is an open-source, browser-based environment for interactive computing that blends executable code with rich media in a single document. Work is organized into discrete cells that can be run individually, with each cell’s output persisted in the notebook.
A Texera workflow provides an operator-centric abstraction for data-science pipelines. A workflow is a directed acyclic graph (DAG) in which every node is an operator, such as CSV Scan, Projection, Filter, Aggregate, Python UDF, or ML Model, and an edge represents the flow of data between operators.
Migrating notebook code into Texera operators, then wiring those operators with links, transforms ad-hoc analyses into shareable, pipeline-oriented workflows that enable collaboration and scalable execution.
The notebook, dataset and workflow in this example are available on TexeraHub.
Notebook Overview
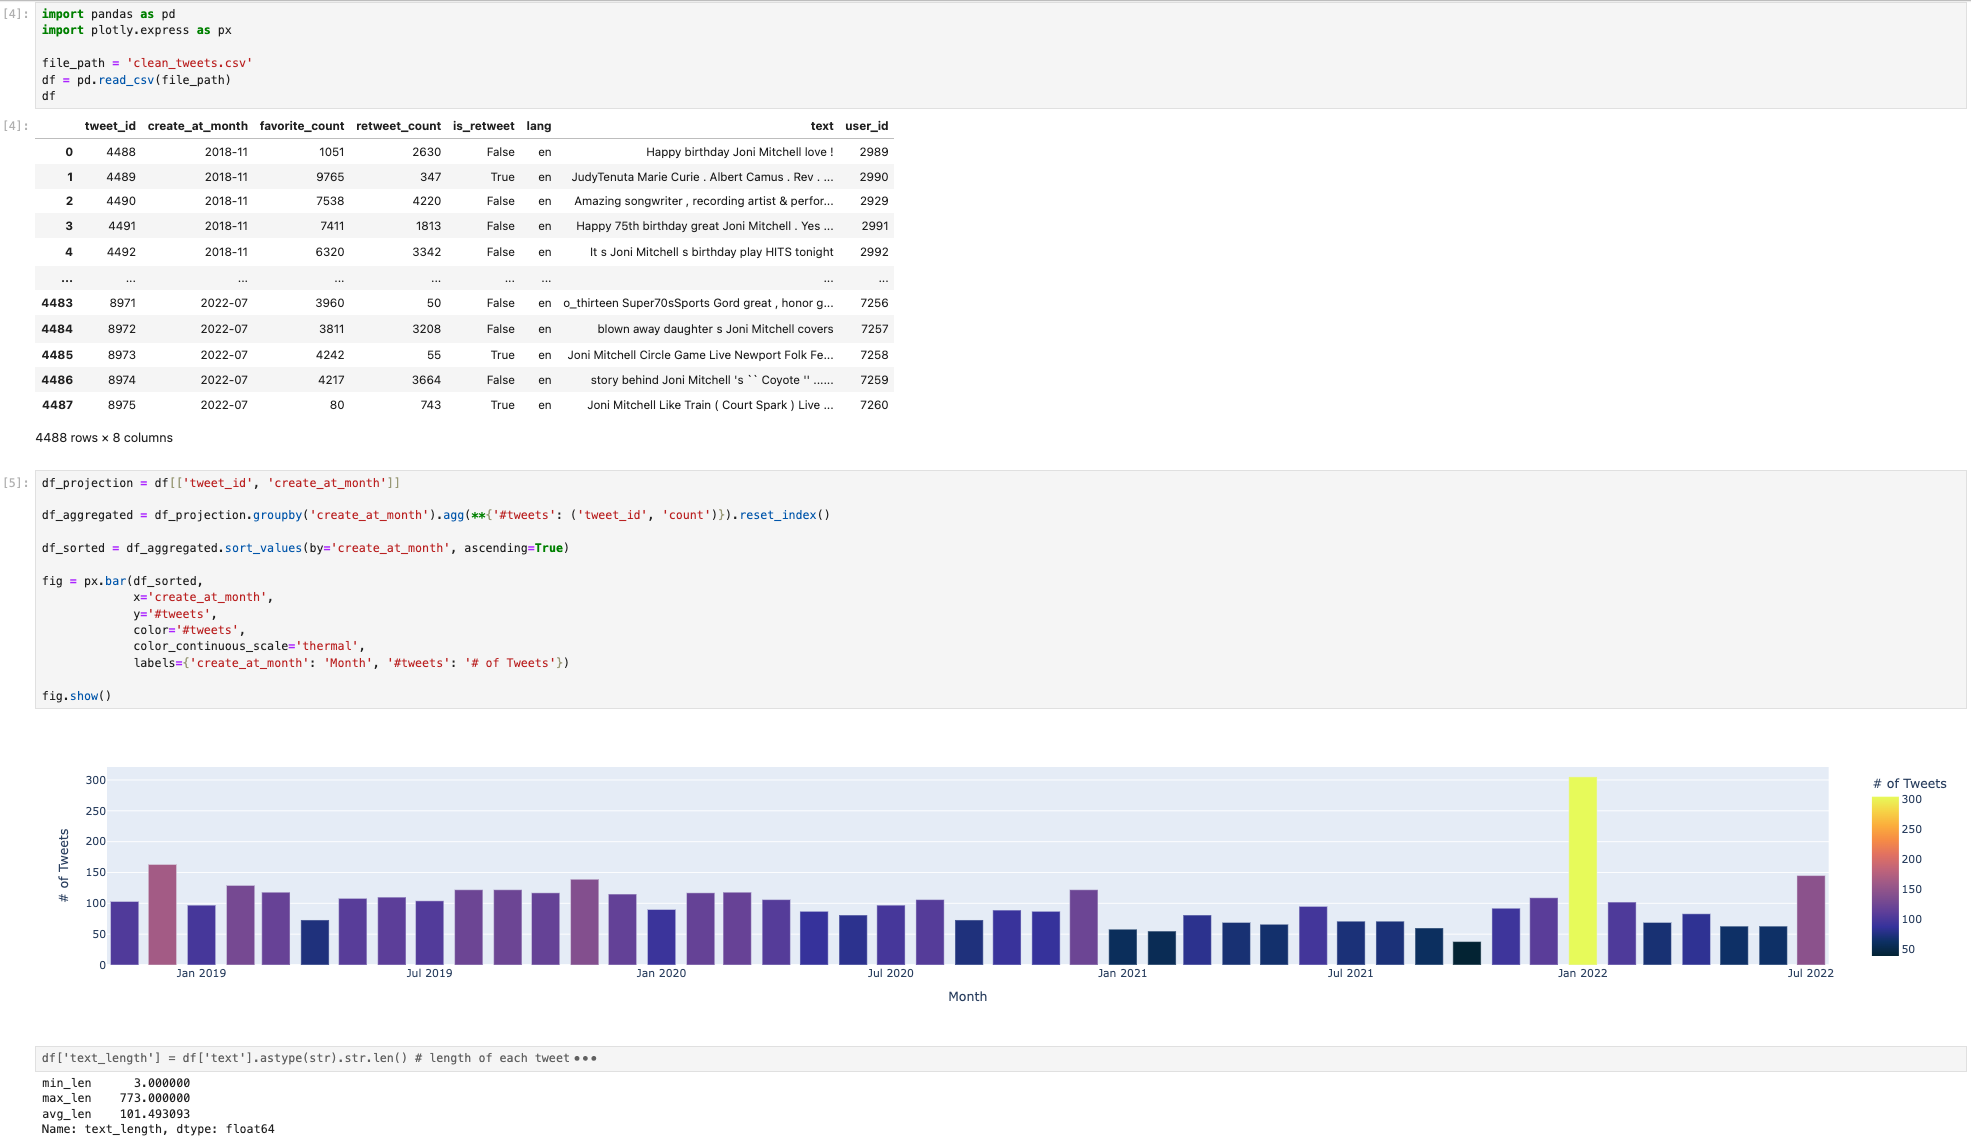
We will use a Tweet-Analysis notebook to demonstrate the migration process. The notebook has three cells:
import pandas as pd
import plotly.express as px

file_path = 'clean_tweets.csv'
df = pd.read_csv(file_path)
df
df_projection = df[['tweet_id', 'create_at_month']]
df_aggregated = df_projection.groupby('create_at_month').agg(**{'#tweets': ('tweet_id', 'count')}).reset_index()
df_sorted = df_aggregated.sort_values(by='create_at_month', ascending=True)
fig = px.bar(df_sorted,
             x='create_at_month',
             y='#tweets',
             color='#tweets',
             color_continuous_scale='thermal',
             labels={'create_at_month': 'Month', '#tweets': '# of Tweets'})
fig.show()
df['text_length'] = df['text'].astype(str).str.len()
length_stats = df['text_length'].agg(['min', 'max', 'mean'])
print(length_stats)
Below is the screenshot of the notebook after the execution:
2.1. Identify the data files and upload them to a Texera dataset
From cell 1, we see the notebook reads clean_tweets.csv.
#...
file_path = 'clean_tweets.csv'
df = pd.read_csv(file_path)
df
To let Texera read the same file, create a dataset in Texera, drag-and-drop the CSV file into it, and create a version:
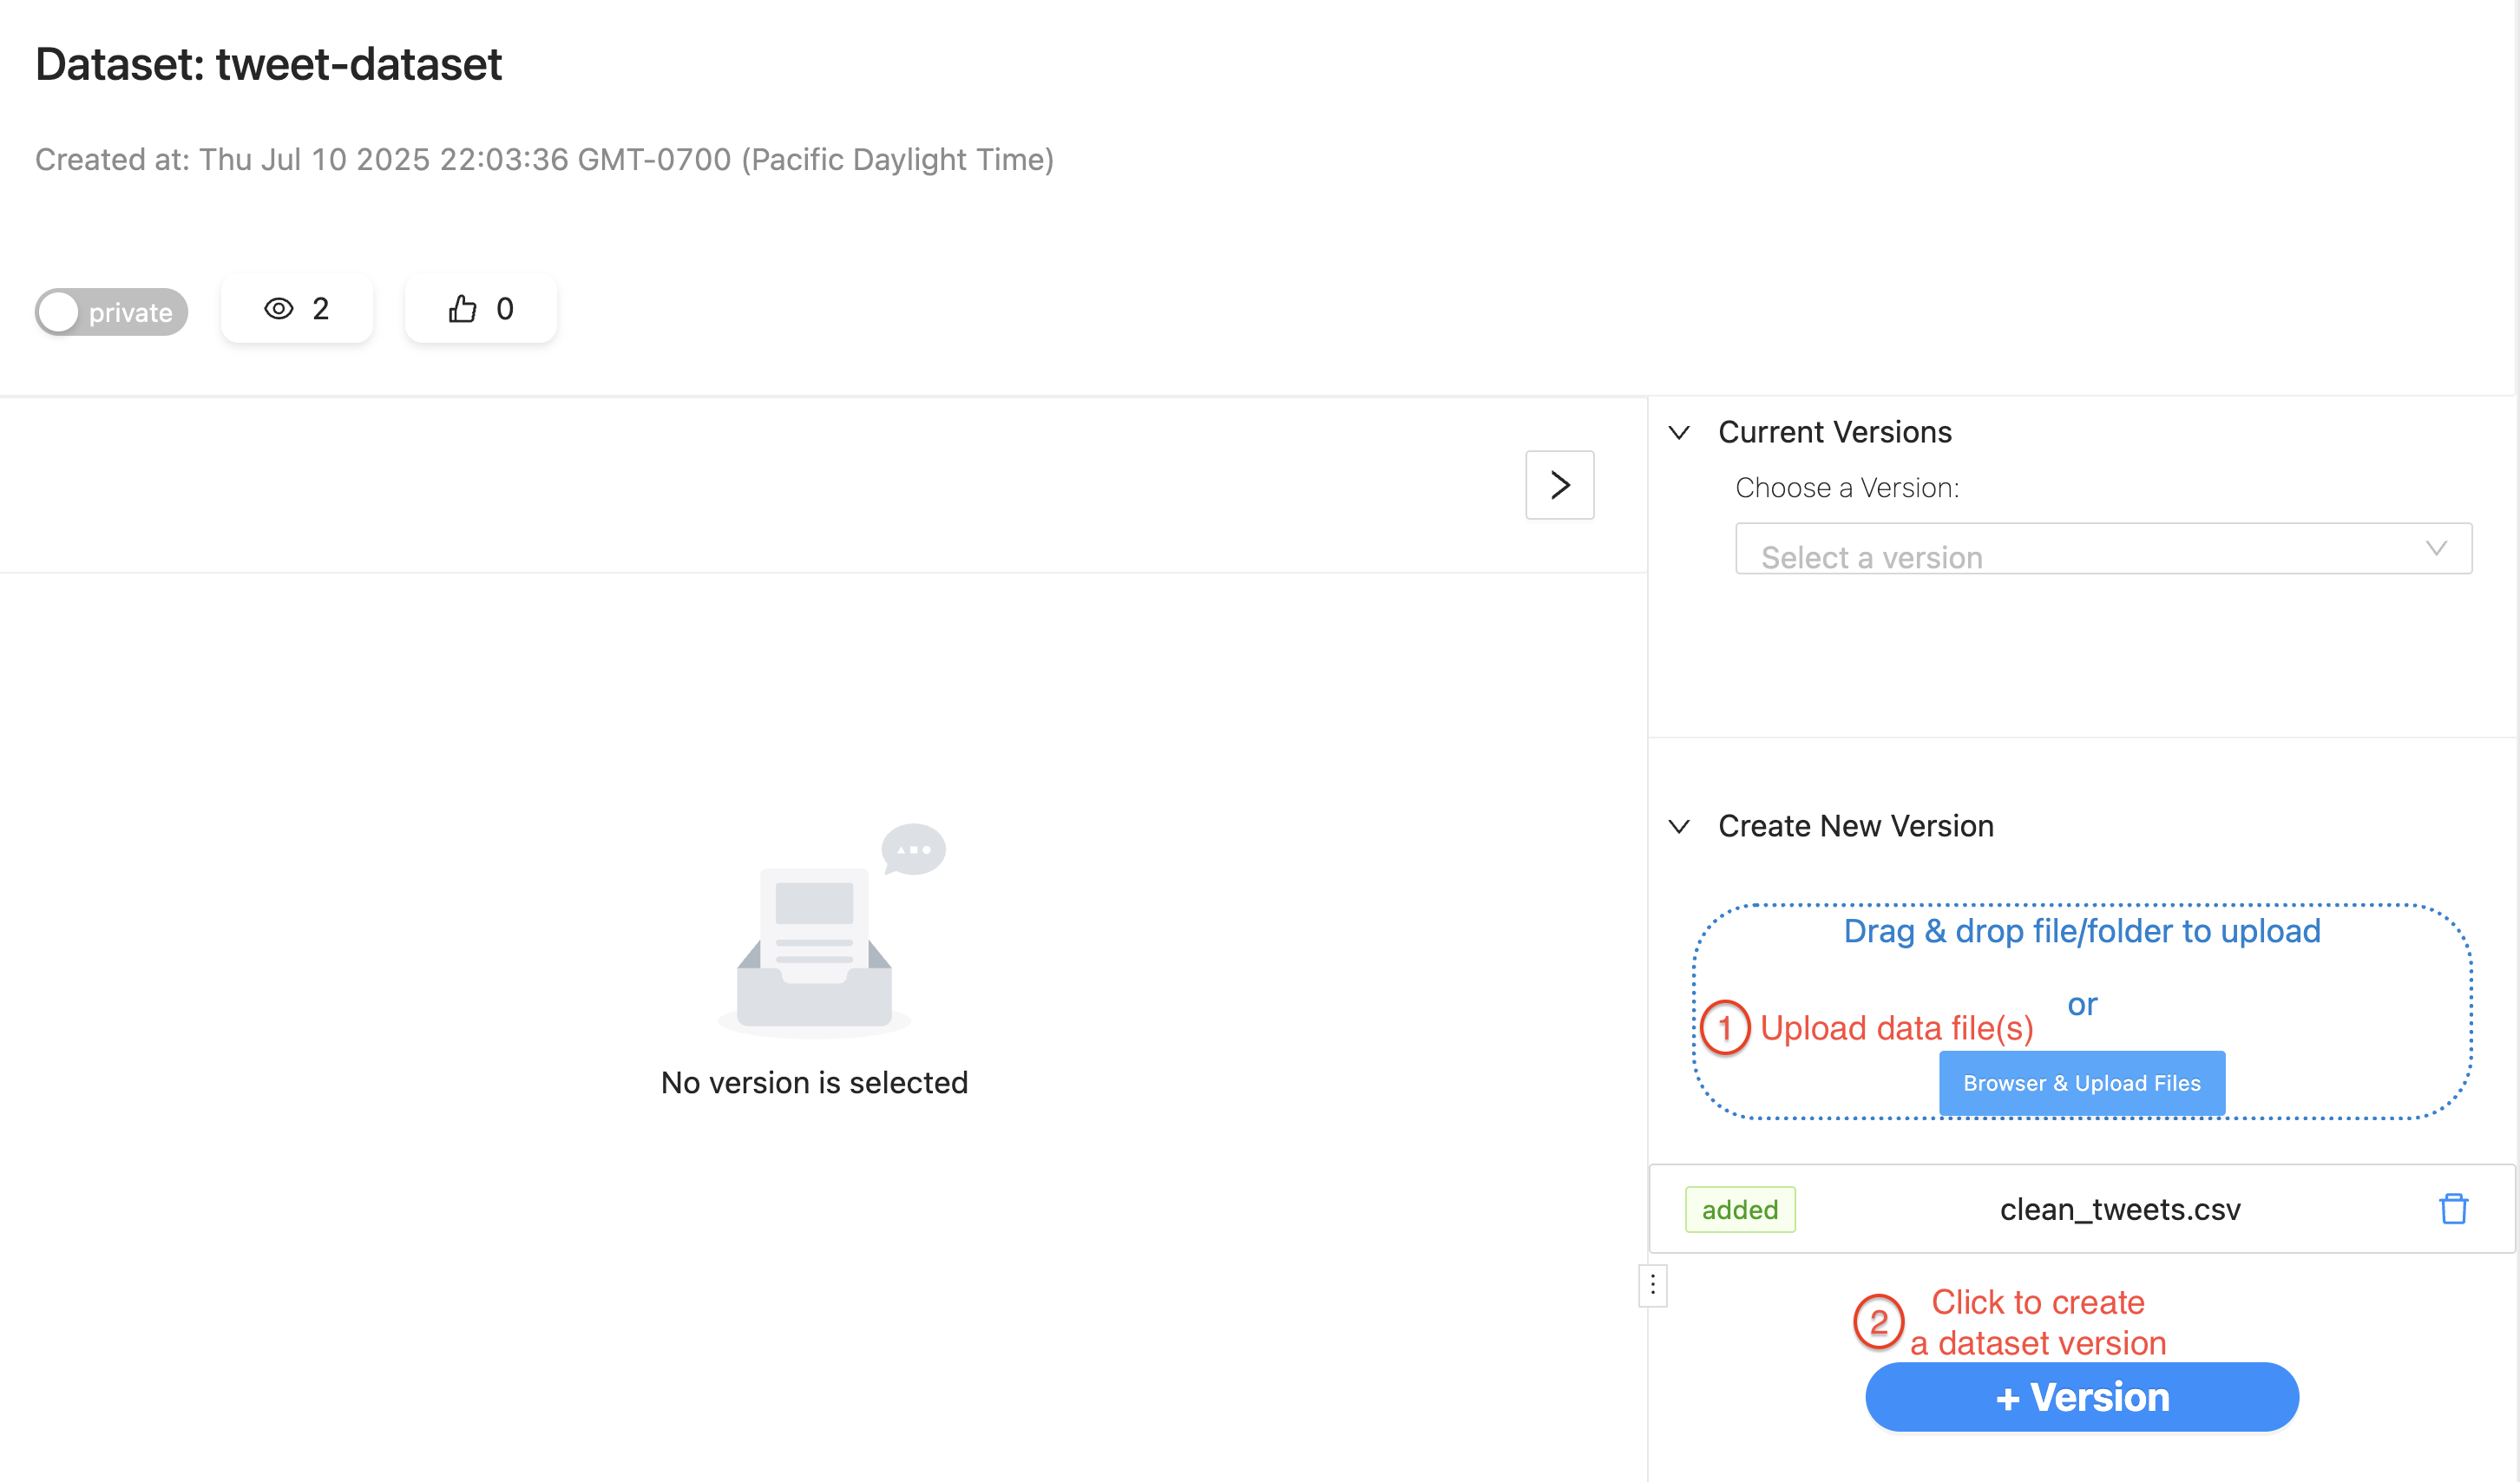
After the file is in a dataset, create a workflow and add a data-input operator that reads the file.
Because the file is CSV, we should use CSVFileScanOperator and specify the file path. Running the workflow should display the same table as Cell 1 in the result panel:
After this step, we have successfully converted cell 1 into a Texera operator.
2.3. Migrate data-processing logic into operators and links
Case 1: Use native operators for common processing logic
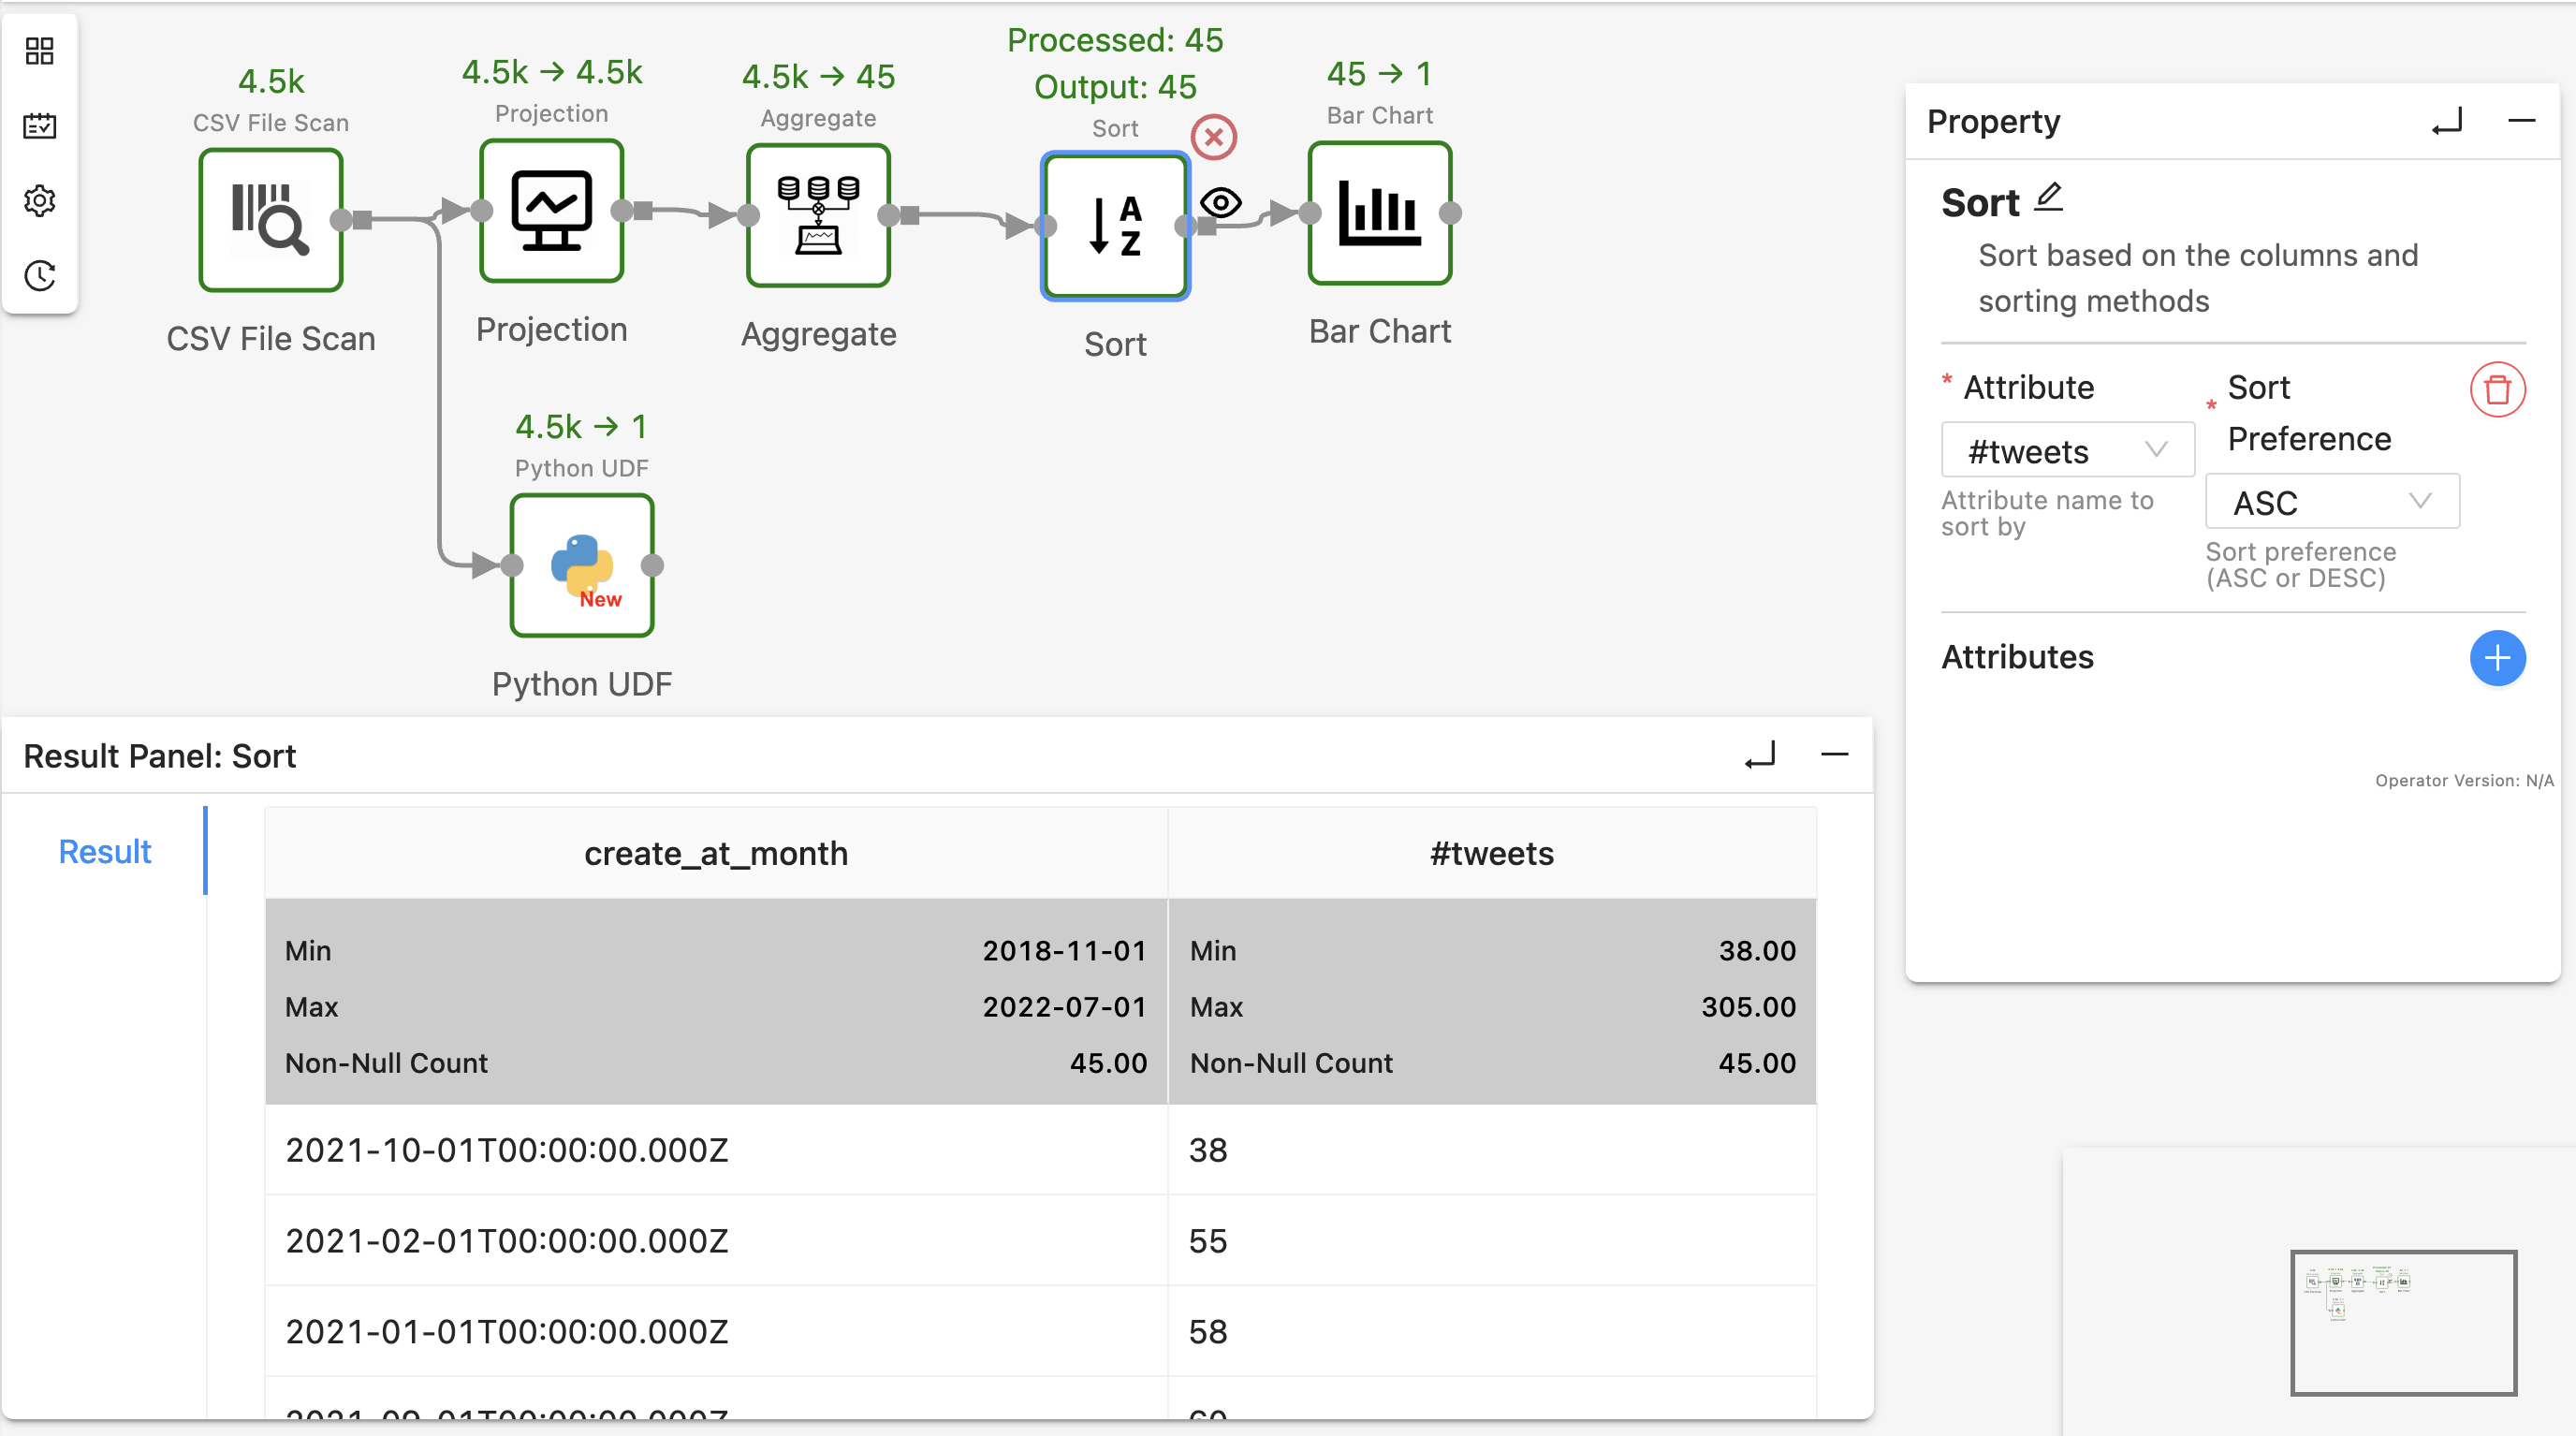
Cell 2 performs a sequence of operations after reading the data source: projection to keep only two columns, aggregation to calculate the number of tweets per month, sort based on count, and then visualizing using the bar chart:
df_projection = df[['tweet_id', 'create_at_month']]
df_aggregated = df_projection.groupby('create_at_month').agg(**{'#tweets': ('tweet_id', 'count')}).reset_index()
df_sorted = df_aggregated.sort_values(by='create_at_month', ascending=True)
fig = px.bar(df_sorted,
             x='create_at_month',
             y='#tweets',
             color='#tweets',
             color_continuous_scale='thermal',
             labels={'create_at_month': 'Month', '#tweets': '# of Tweets'})
fig.show()
These operations are very common in data science pipelines. And Texera provides several native operators that have the exact same functionalities and are easy to use:
- Projection operator →
df[['tweet_id', 'create_at_month']] - Aggregate operator →
groupby('create_at_month').agg(...).reset_index() - Sort operator →
sort_values(by='create_at_month', ascending=True) - Barchart operator →
px.bar(...)
Therefore, we can drag-n-drop these operators, connect them after the CSVFileScan. Running the workflow should display the same bar chart as in Cell 2.
Now we have successfully migrate cell 2 into Texera.
Case 2: Use UDF operators for complex processing logic
According to cell 3, a new column is added to the original tweet data table to represent the length of the text column. After that, min, max, mean of the text_length column are calculated.
df['text_length'] = df['text'].astype(str).str.len()
length_stats = df['text_length'].agg(['min', 'max', 'mean'])
print(length_stats.rename({'min': 'min_len', 'max': 'max_len', 'mean': 'avg_len'}))
For code that involves column addition/removal and other complex data operations, Texera supports UDF operators that allow users to write custom logic as an operator that processes the data.
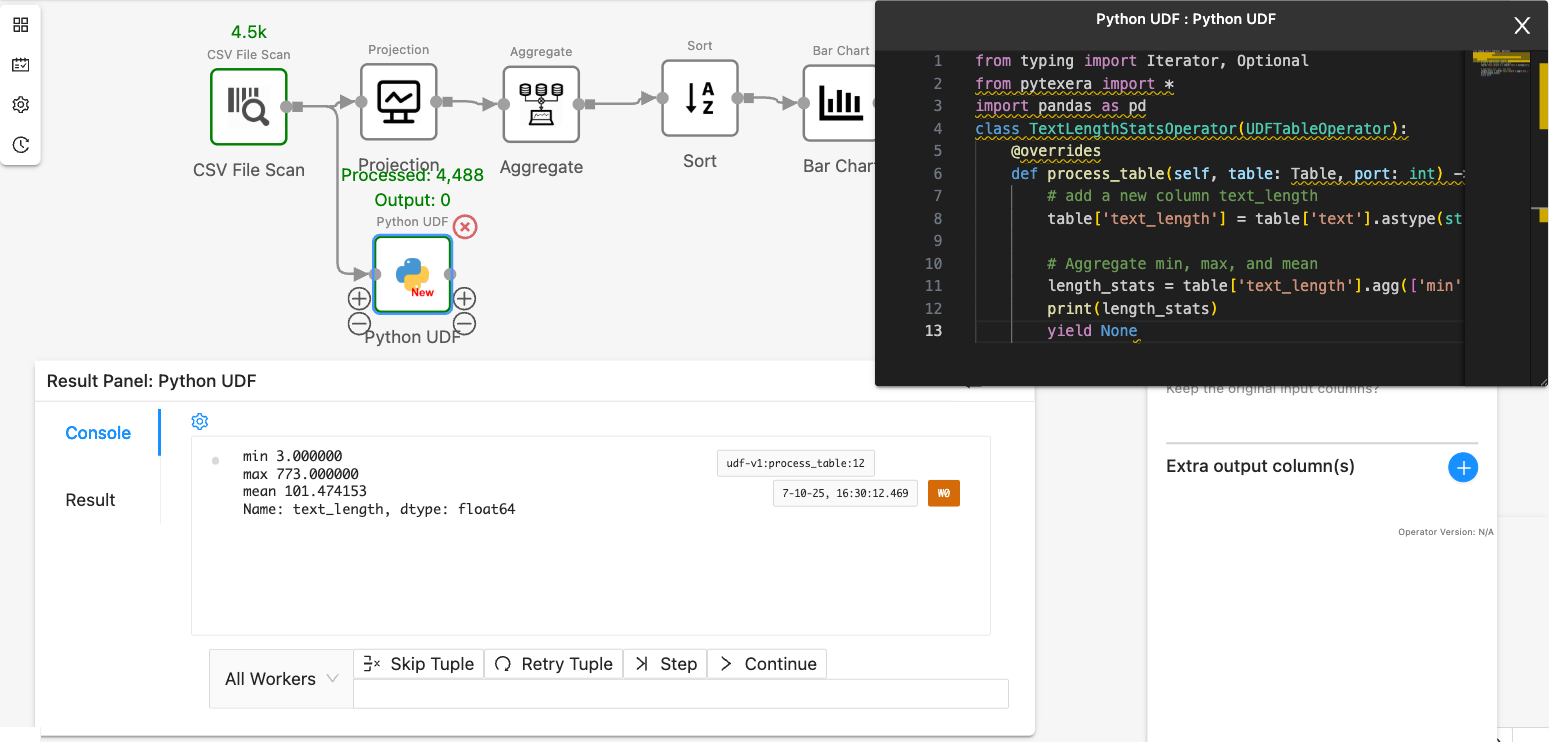
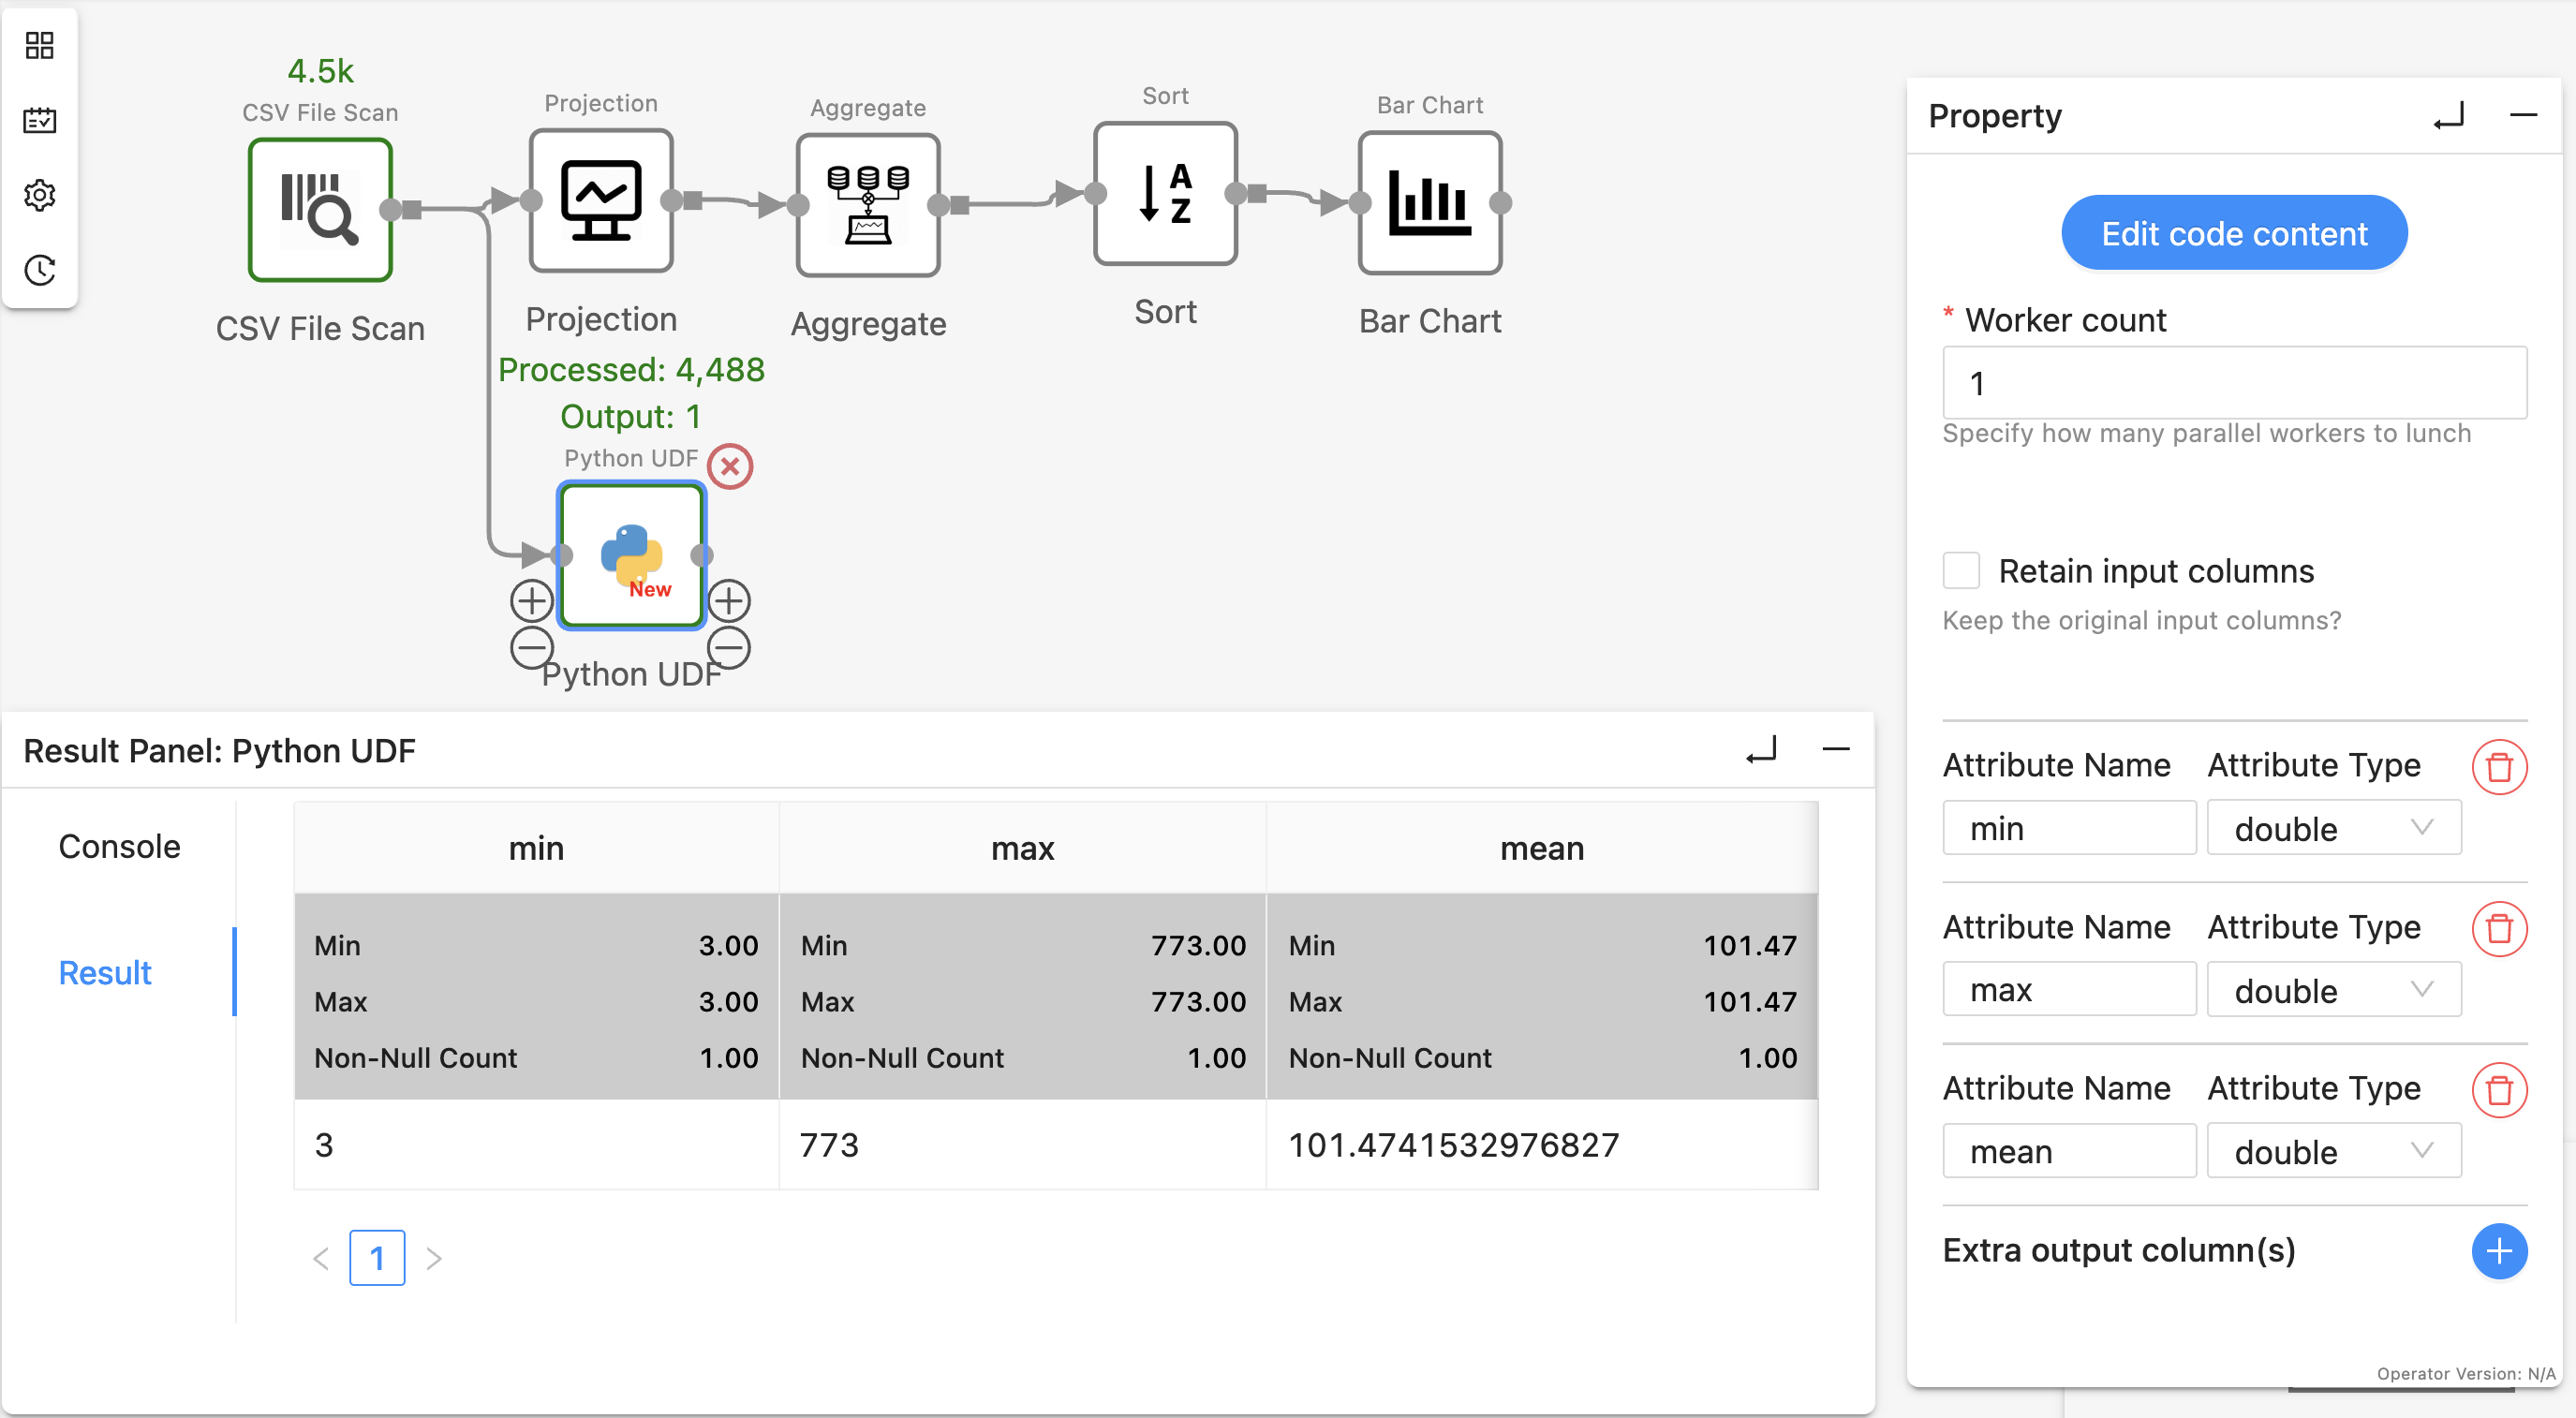
In this example, we can add a PythonUDF operator after the CSVScanOperator. Inside the UDF we use TableAPI as it involves the table-level column addition. Since in the pytexera package, Table supports most of the pandas Dataframe APIs, we can simply adjust the code in Cell 3 and put it into UDF as the processing logic. There are two ways to show the final result:
- Use
print statement in the UDF code block. The result will be shown in the “Console” tab:
from typing import Iterator, Optional
from pytexera import *
import pandas as pd
class TextLengthStatsOperator(UDFTableOperator):
    @overrides
    def process_table(self, table: Table, port: int) -> Iterator[Optional[TableLike]]:
        # add a new column text_length
        table['text_length'] = table['text'].astype(str).str.len()

        # Aggregate min, max, and mean
        length_stats = table['text_length'].agg(['min', 'max', 'mean'])
        print(length_stats)
        yield None
- Yield the result as a table with columns
min, max, and mean to the downstream. Make sure to declare the output schema in the operator panel. The result will be shown in the “Result” tab:
from typing import Iterator, Optional
from pytexera import *
import pandas as pd
class TextLengthStatsOperator(UDFTableOperator):
    @overrides
    def process_table(self, table: Table, port: int) -> Iterator[Optional[TableLike]]:
        # add a new column text_length
        table['text_length'] = table['text'].astype(str).str.len()

        # Aggregate min, max, and mean
        length_stats = table['text_length'].agg(['min', 'max', 'mean'])
        yield length_stats
Step 4: Annotate some operators as ‘View Result’ to display the same results as Notebook
Jupyter displays the output of every cell, whereas Texera shows only sink-operator outputs by default.
To view intermediate results, for example, the results after SortOperator, right-click the operator, select “View Result” shown in the drop-down menu, and re-run the workflow:
Texera will now show the operator’s output in the result panel.
3. Tips
- Utilize Texera native operators as much as possible
Texera contains more than 110 built-in operators that cover data loading, cleaning, wrangling, visualization, and AI/ML. Replacing custom code with native operators makes workflows clearer and usually improves performance.
- Identify the data dependencies in the Python code in order to connect operators
In Texera, data flows along links. Before wiring operators, review the notebook to understand which variables feed which; then reproduce those dependencies via links so the executions matches the original notebook.
5 - Reference
In-depth technical and configuration references for Texera’s components and environment.
This section contains detailed, low-level reference materials for Texera’s configuration, components, and internal modules.
The Reference section provides look-up documentation for developers and maintainers who need specific, technical information about Texera’s internals or environment.
Unlike the Concepts section, which explains how Texera works, this section focuses on how Texera is configured, built, and extended.
What you’ll find here
This section includes reference information for:
- Configuration and Environment Setup: Detailed parameters and environment variables used for development, deployment, and testing.
- Project Structure: Explanation of major code directories, module dependencies, and naming conventions.
- Execution Engine Details: Low-level reference for engine modules, operators’ lifecycle, and workflow translation.
- Operator Framework: Technical notes on operator registration, metadata, and extension mechanisms.
- Frontend Components: Descriptions of UI module structure, Angular components, and visualization hooks.
- Persistence and Storage: Information about Texera’s internal storage models, catalog, and workflow metadata.
When to use this section
Use this section when you need:
- To understand or modify Texera’s internal modules or configuration files.
- To debug, extend, or refactor parts of the codebase.
- To deploy Texera in a local, testing, or production environment and need to adjust settings or dependencies.
How to maintain this section
Reference pages are often technical and version-specific. Keep them up to date by:
- Linking or embedding auto-generated documentation from code comments (e.g., Javadoc for backend modules or TypeDoc for frontend).
- Including manual reference pages for configuration files, startup scripts, and architecture diagrams.
- Updating this section whenever internal modules or configuration formats change.
Suggested subpages
| File | Purpose |
|---|
reference/configuration.md | Environment variables, ports, and server settings. |
reference/project-structure.md | Directory overview and build system explanation. |
reference/engine.md | Detailed explanation of execution engine internals. |
reference/operators/ | Built-in operator catalog, grouped by category. |
reference/frontend.md | Frontend architecture and components. |
reference/storage.md | Persistence layer, catalog, and metadata handling. |
This section is meant to be a developer’s technical handbook for Texera’s internal systems — a precise reference for anyone maintaining, extending, or deploying the platform.
5.1 - Operators
Complete reference for all Texera operators organized by category
Quick Links
Operator Categories
5.1.1 - Data Input
Operators in the Data Input category
Home > Data Input
Operators
Total: 8 operators
5.1.1.1 - Arrow File Scan
Scan data from an Arrow file
Home > Data Input
| Property | Requirement | Type | Default | Description |
|---|
| File | ✓ | String | - | |
| Limit | | Integer | - | Max output count |
| Offset | | Integer | - | Starting point of output |
Output Ports
5.1.1.2 - CSV File Scan
Scan data from a CSV file
Home > Data Input
| Property | Requirement | Type | Default | Description |
|---|
| File | ✓ | String | - | |
| File Encoding | ✓ | UTF_8, UTF_16, US_ASCII | UTF_8 | Decoding charset to use on input |
| Limit | | Integer | - | Max output count |
| Offset | | Integer | - | Starting point of output |
| Delimiter | | String | , | Delimiter to separate each line into fields |
| Header | | Boolean | true | Whether the CSV file contains a header line |
Output Ports
5.1.1.3 - CSVOld File Scan
Scan data from a CSVOld file
Home > Data Input
| Property | Requirement | Type | Default | Description |
|---|
| File | ✓ | String | - | |
| File Encoding | ✓ | UTF_8, UTF_16, US_ASCII | UTF_8 | Decoding charset to use on input |
| Limit | | Integer | - | Max output count |
| Offset | | Integer | - | Starting point of output |
| Delimiter | | String | , | Delimiter to separate each line into fields |
| Header | | Boolean | true | Whether the CSV file contains a header line |
Output Ports
5.1.1.4 - File Lister
Select a dataset version and output one filename tuple per file
Home > Data Input
| Property | Requirement | Type | Default | Description |
|---|
| Dataset | ✓ | String | - | |
Output Ports
5.1.1.5 - File Scan
Scan data from a file
Home > Data Input
| Property | Requirement | Type | Default | Description |
|---|
| File | ✓ | String | - | |
| Encoding | ✓ | UTF_8, UTF_16, US_ASCII | UTF_8 | |
| Extract | | Boolean | false | |
| ↳ Include Filename | | Boolean | false | |
| Attribute Type | ✓ | string, single string, integer, long,
double, boolean, timestamp, binary,
large binary | string | |
| Attribute Name | ✓ | String | line | |
| Limit | | Integer | - | |
| Offset | | Integer | - | |
Output Ports
5.1.1.6 - File Scan From Input
Scan data from file paths provided by input tuples
Home > Data Input
| Property | Requirement | Type | Default | Description |
|---|
| Encoding | ✓ | UTF_8, UTF_16, US_ASCII | UTF_8 | |
| Extract | | Boolean | false | |
| Include Filename | | Boolean | false | |
| Attribute Type | ✓ | string, single string, integer, long,
double, boolean, timestamp, binary,
large binary | string | |
| Attribute Name | ✓ | String | line | |
| Limit | | Integer | - | |
| Offset | | Integer | - | |
Output Ports
5.1.1.7 - JSONL File Scan
Scan data from a JSONL file
Home > Data Input
| Property | Requirement | Type | Default | Description |
|---|
| File | ✓ | String | - | |
| File Encoding | ✓ | UTF_8, UTF_16, US_ASCII | UTF_8 | Decoding charset to use on input |
| Limit | | Integer | - | Max output count |
| Offset | | Integer | - | Starting point of output |
| Flatten | ✓ | Boolean | false | Flatten nested objects and arrays |
Output Ports
5.1.1.8 - Text Input
Source data from manually inputted text
Home > Data Input
| Property | Requirement | Type | Default | Description |
|---|
| Text | ✓ | String | - | |
| Attribute Type | ✓ | string, single string, integer, long,
double, boolean, timestamp, binary,
large binary | string | |
| Attribute Name | ✓ | String | line | |
| Limit | | Integer | - | |
| Offset | | Integer | - | |
Output Ports
5.1.2 - Database Connector
Operators in the Database Connector category
Home > Database Connector
Operators
Total: 3 operators
5.1.2.1 - AsterixDB Source
Read data from a AsterixDB instance
Home > Database Connector
| Property | Requirement | Type | Default | Description |
|---|
| Host | ✓ | String | - | |
| Port | ✓ | String | default | A port number or ‘default’ |
| Database | ✓ | String | - | |
| Table Name | ✓ | String | - | |
| Limit | | Long | - | Max output count |
| Offset | | Long | - | Starting point of output |
| Keyword Search? | | Boolean | false | |
| ↳ Keyword Search Column | | String | - | |
| ↳ Keywords to Search | | String | - | “[‘hello’, ‘world’], {‘mode’:‘any’}” OR
"[‘hello’, ‘world’], {‘mode’:‘all’}" |
| Progressive? | | Boolean | false | |
| ↳ Batch by Column | | String | - | |
| ↳ Min | | String | auto | |
| ↳ Max | | String | auto | |
| ↳ Batch by Interval | | Long | 1000000000 | |
| Geo Search? | | Boolean | false | |
| ↳ Geo Search By Columns | | List | - | Column(s) to check if any of them is in the
bounding box below |
| ↳ Geo Search Bounding Box | | List | - | At least 2 entries should be provided to form a
bounding box. format of each entry: long, lat |
| Regex Search? | | Boolean | false | |
| ↳ Regex Search By Column | | String | - | |
| ↳ Regex to Search | | String | - | |
| Filter Condition? | | Boolean | false | |
| ↳ Predicates | | List | - | Multiple predicates in OR |
| ↳ Attribute | ✓ | String | - | |
| ↳ Condition | ✓ | =, >, >=, <, <=, !=, is null,
is not null | - | |
| ↳ Value | | String | - | |
Output Ports
5.1.2.2 - MySQL Source
Read data from a MySQL instance
Home > Database Connector
| Property | Requirement | Type | Default | Description |
|---|
| Host | ✓ | String | - | |
| Port | ✓ | String | default | A port number or ‘default’ |
| Database | ✓ | String | - | |
| Table Name | ✓ | String | - | |
| Username | ✓ | String | - | |
| Password | ✓ | String | - | |
| Limit | | Long | - | Max output count |
| Offset | | Long | - | Starting point of output |
| Keyword Search? | | Boolean | false | |
| ↳ Keyword Search Column | | String | - | |
| ↳ Keywords to Search | | String | - | |
| Progressive? | | Boolean | false | |
| ↳ Batch by Column | | String | - | |
| ↳ Min | | String | auto | |
| ↳ Max | | String | auto | |
| ↳ Batch by Interval | | Long | 1000000000 | |
Output Ports
5.1.2.3 - PostgreSQL Source
Read data from a PostgreSQL instance
Home > Database Connector
| Property | Requirement | Type | Default | Description |
|---|
| Host | ✓ | String | - | |
| Port | ✓ | String | default | A port number or ‘default’ |
| Database | ✓ | String | - | |
| Table Name | ✓ | String | - | |
| Username | ✓ | String | - | |
| Password | ✓ | String | - | |
| Limit | | Long | - | Max output count |
| Offset | | Long | - | Starting point of output |
| Keyword Search? | | Boolean | false | |
| ↳ Keyword Search Column | | String | - | |
| ↳ Keywords to Search | | String | - | E.g. ‘sore & throat’ for AND; ‘sore’, ’throat’
for OR. See official postgres documents for
details |
| Progressive? | | Boolean | false | |
| ↳ Batch by Column | | String | - | |
| ↳ Min | | String | auto | |
| ↳ Max | | String | auto | |
| ↳ Batch by Interval | | Long | 1000000000 | |
Output Ports
5.1.3 - Search
Operators in the Search category
Home > Search
Operators
Total: 4 operators
5.1.3.1 - Dictionary matcher
Matches tuples if they appear in a given dictionary
Home > Search
| Property | Requirement | Type | Default | Description |
|---|
| Dictionary | ✓ | String | - | Dictionary values separated by a comma |
| Attribute | ✓ | String | - | Column name to match |
| Result Attribute | ✓ | String | matched | Column name of the matching result |
| Matching Type | ✓ | Scan, Substring, Conjunction | - | |
Output Ports
5.1.3.2 - Keyword Search
Search for keyword(s) in a string column
Home > Search
| Property | Requirement | Type | Default | Description |
|---|
| attribute | ✓ | String | - | Column to search keyword on |
| keywords | ✓ | String | - | Keywords |
Output Ports
5.1.3.3 - Regular Expression
Search a regular expression in a string column
Home > Search
| Property | Requirement | Type | Default | Description |
|---|
| Case Insensitive | | Boolean | false | Regex match is case sensitive |
| Attribute | ✓ | String | - | Column to search regex on |
| Regex | ✓ | String | - | Regular expression |
Output Ports
5.1.3.4 - Substring Search
Search for Substring(s) in a string column
Home > Search
| Property | Requirement | Type | Default | Description |
|---|
| attribute | ✓ | String | - | Column to search substring on |
| Substring | ✓ | String | - | Substring |
| Case Sensitive | ✓ | Boolean | false | Whether the substring match is case sensitive |
Output Ports
5.1.4 - Data Cleaning
Operators in the Data Cleaning category
Home > Data Cleaning
Subcategories
Operators
| Operator | Description |
|---|
| Distinct | Remove duplicate tuples |
| Filter | Performs a filter operation using OR between multiple predicates |
| Limit | Limit the number of output rows |
| Projection | Keeps or drops the column |
| Type Casting | Cast between types |
Total: 5 operators
5.1.4.1 - Join
Operators in the Join category
Home > Data Cleaning > Join
Operators
| Operator | Description |
|---|
| Cartesian Product | Append fields together to get the cartesian product of two inputs |
| Hash Join | Join two inputs |
| Interval Join | Join two inputs with left table join key in the range of [right table join key, right table join key + constant value] |
Total: 3 operators
5.1.4.1.1 - Cartesian Product
Append fields together to get the cartesian product of two inputs
Home > Data Cleaning > Join
Output Ports
5.1.4.1.2 - Hash Join
Join two inputs
Home > Data Cleaning > Join
| Property | Requirement | Type | Default | Description |
|---|
| Left Input Attribute | ✓ | String | - | Attribute to be joined on the Left Input |
| Right Input Attribute | ✓ | String | - | Attribute to be joined on the Right Input |
| Join Type | ✓ | inner, left outer, right outer,
full outer | inner | Select the join type to execute |
Output Ports
5.1.4.1.3 - Interval Join
Join two inputs with left table join key in the range of [right table join key, right table join key + constant value]
Home > Data Cleaning > Join
| Property | Requirement | Type | Default | Description |
|---|
| Interval Constant | ✓ | Long | 10 | Left attri in (right, right + constant) |
| Include Left Bound | ✓ | Boolean | true | Include condition left attri = right attri |
| Include Right Bound | ✓ | Boolean | true | Include condition left attri = right attri |
| Time interval type | | TimeIntervalType | day | Year, Month, Day, Hour, Minute or Second |
| Left Input attr | ✓ | String (integer, long, double, timestamp) | - | Choose one attribute in the left table |
| Right Input attr | ✓ | String | - | Choose one attribute in the right table |
Output Ports
5.1.4.2 - Set
Operators in the Set category
Home > Data Cleaning > Set
Operators
| Operator | Description |
|---|
| Difference | Find the set difference of two inputs |
| Intersect | Take the intersect of two inputs |
| SymmetricDifference | Find the symmetric difference (the set of elements which are in either of the sets, but not in their intersection) of two inputs |
| Union | Unions the output rows from multiple input operators |
Total: 4 operators
5.1.4.2.1 - Difference
Find the set difference of two inputs
Home > Data Cleaning > Set
Output Ports
5.1.4.2.2 - Intersect
Take the intersect of two inputs
Home > Data Cleaning > Set
Output Ports
5.1.4.2.3 - SymmetricDifference
Find the symmetric difference (the set of elements which are in either of the sets, but not in their intersection) of two inputs
Home > Data Cleaning > Set
Output Ports
5.1.4.2.4 - Union
Unions the output rows from multiple input operators
Home > Data Cleaning > Set
Output Ports
5.1.4.3 - Aggregate
Operators in the Aggregate category
Home > Data Cleaning > Aggregate
Operators
| Operator | Description |
|---|
| Aggregate | Calculate different types of aggregation values |
Total: 1 operator
5.1.4.3.1 - Aggregate
Calculate different types of aggregation values
Home > Data Cleaning > Aggregate
| Property | Requirement | Type | Default | Description |
|---|
| Aggregations | ✓ | List | - | Multiple aggregation functions (min: 1,
aggregations cannot be empty) |
| ↳ Aggregate Func | ✓ | sum, count, average, min, max, concat | - | Sum, count, average, min, max, or concat |
| ↳ Attribute | ✓ | String | - | Column to calculate average value |
| ↳ Result Attribute | ✓ | String | - | Column name of average result |
| Group By Keys | | List | - | Group by columns |
Output Ports
5.1.4.4 - Sort
Operators in the Sort category
Home > Data Cleaning > Sort
Operators
| Operator | Description |
|---|
| Sort | Sort based on the columns and sorting methods |
| Sort Partitions | Sort Partitions |
| Stable Merge Sort | Stable per-partition sort with multi-key ordering (incremental stack of sorted buckets) |
Total: 3 operators
5.1.4.4.1 - Sort
Sort based on the columns and sorting methods
Home > Data Cleaning > Sort
| Property | Requirement | Type | Default | Description |
|---|
| Attributes | ✓ | List | - | Column to perform sorting on |
| ↳ Attribute | ✓ | String | - | Attribute name to sort by |
| ↳ Sort Preference | ✓ | ASC, DESC | - | Sort preference (ASC or DESC) |
Output Ports
5.1.4.4.2 - Sort Partitions
Sort Partitions
Home > Data Cleaning > Sort
| Property | Requirement | Type | Default | Description |
|---|
| Attribute | ✓ | String (integer, long, double) | - | Attribute to sort (must be numerical) |
| Attribute Domain Min | ✓ | Long | 0 | Minimum value of the domain of the attribute |
| Attribute Domain Max | ✓ | Long | 0 | Maximum value of the domain of the attribute |
Output Ports
5.1.4.4.3 - Stable Merge Sort
Stable per-partition sort with multi-key ordering (incremental stack of sorted buckets)
Home > Data Cleaning > Sort
| Property | Requirement | Type | Default | Description |
|---|
| Sort Keys | ✓ | List | - | List of attributes to sort by with ordering
preferences |
| ↳ Attribute | ✓ | String | - | Attribute name to sort by |
| ↳ Sort Preference | ✓ | ASC, DESC | - | Sort preference (ASC or DESC) |
Output Ports
5.1.4.5 - Distinct
Remove duplicate tuples
Home > Data Cleaning
Output Ports
5.1.4.6 - Filter
Performs a filter operation using OR between multiple predicates
Home > Data Cleaning
| Property | Requirement | Type | Default | Description |
|---|
| Predicates | ✓ | List | - | Multiple predicates in OR |
| ↳ Attribute | ✓ | String | - | |
| ↳ Condition | ✓ | =, >, >=, <, <=, !=, is null,
is not null | - | |
| ↳ Value | | String | - | |
Output Ports
5.1.4.7 - Limit
Limit the number of output rows
Home > Data Cleaning
| Property | Requirement | Type | Default | Description |
|---|
| Limit | ✓ | Integer | 0 | The max number of output rows |
Output Ports
5.1.4.8 - Projection
Keeps or drops the column
Home > Data Cleaning
| Property | Requirement | Type | Default | Description |
|---|
| Drop Option | ✓ | Boolean | false | Check to drop the selected attributes |
| Attributes | ✓ | List | - | |
| ↳ Attribute | ✓ | String | - | Attribute name in the schema |
| ↳ Alias | | String | - | Renamed attribute name |
Output Ports
5.1.4.9 - Type Casting
Cast between types
Home > Data Cleaning
| Property | Requirement | Type | Default | Description |
|---|
| TypeCasting Units | ✓ | List | - | Multiple type castings |
| ↳ Attribute | ✓ | String | - | Attribute for type casting |
| ↳ Cast type | ✓ | string, integer, long, double, boolean,
timestamp, binary, large_binary | - | Result type after type casting |
Output Ports
5.1.5 - Machine Learning
Operators in the Machine Learning category
Home > Machine Learning
Subcategories
5.1.5.1 - Sklearn
Operators in the Sklearn category
Home > Machine Learning > Sklearn
Subcategories
Operators
Total: 28 operators
5.1.5.1.1 - Sklearn Training
Operators in the Sklearn Training category
Home > Sklearn > Sklearn Training
Operators
Total: 26 operators
5.1.5.1.1.1 - Training: Adaptive Boosting
Sklearn Training: Adaptive Boosting Operator
Home > Machine Learning > Sklearn > Sklearn Training
| Property | Requirement | Type | Default | Description |
|---|
| Target Attribute | ✓ | String | - | Attribute in your dataset corresponding to target |
| Count Vectorizer | | Boolean | false | Convert a collection of text documents to a
matrix of token counts |
| ↳ Text Attribute | | String | - | Attribute in your dataset with text to vectorize |
| ↳ Tfidf Transformer | | Boolean | false | Transform a count matrix to a normalized tf or
tf-idf representation |
Output Ports
5.1.5.1.1.2 - Training: Bagging Training
Sklearn Training: Bagging Training Operator
Home > Machine Learning > Sklearn > Sklearn Training
| Property | Requirement | Type | Default | Description |
|---|
| Target Attribute | ✓ | String | - | Attribute in your dataset corresponding to target |
| Count Vectorizer | | Boolean | false | Convert a collection of text documents to a
matrix of token counts |
| ↳ Text Attribute | | String | - | Attribute in your dataset with text to vectorize |
| ↳ Tfidf Transformer | | Boolean | false | Transform a count matrix to a normalized tf or
tf-idf representation |
Output Ports
5.1.5.1.1.3 - Training: Bernoulli Naive Bayes
Sklearn Training: Bernoulli Naive Bayes Operator
Home > Machine Learning > Sklearn > Sklearn Training
| Property | Requirement | Type | Default | Description |
|---|
| Target Attribute | ✓ | String | - | Attribute in your dataset corresponding to target |
| Count Vectorizer | | Boolean | false | Convert a collection of text documents to a
matrix of token counts |
| ↳ Text Attribute | | String | - | Attribute in your dataset with text to vectorize |
| ↳ Tfidf Transformer | | Boolean | false | Transform a count matrix to a normalized tf or
tf-idf representation |
Output Ports
5.1.5.1.1.4 - Training: Complement Naive Bayes
Sklearn Training: Complement Naive Bayes Operator
Home > Machine Learning > Sklearn > Sklearn Training
| Property | Requirement | Type | Default | Description |
|---|
| Target Attribute | ✓ | String | - | Attribute in your dataset corresponding to target |
| Count Vectorizer | | Boolean | false | Convert a collection of text documents to a
matrix of token counts |
| ↳ Text Attribute | | String | - | Attribute in your dataset with text to vectorize |
| ↳ Tfidf Transformer | | Boolean | false | Transform a count matrix to a normalized tf or
tf-idf representation |
Output Ports
5.1.5.1.1.5 - Training: Decision Tree
Sklearn Training: Decision Tree Operator
Home > Machine Learning > Sklearn > Sklearn Training
| Property | Requirement | Type | Default | Description |
|---|
| Target Attribute | ✓ | String | - | Attribute in your dataset corresponding to target |
| Count Vectorizer | | Boolean | false | Convert a collection of text documents to a
matrix of token counts |
| ↳ Text Attribute | | String | - | Attribute in your dataset with text to vectorize |
| ↳ Tfidf Transformer | | Boolean | false | Transform a count matrix to a normalized tf or
tf-idf representation |
Output Ports
5.1.5.1.1.6 - Training: Dummy Classifier
Sklearn Training: Dummy Classifier Operator
Home > Machine Learning > Sklearn > Sklearn Training
| Property | Requirement | Type | Default | Description |
|---|
| Target Attribute | ✓ | String | - | Attribute in your dataset corresponding to target |
| Count Vectorizer | | Boolean | false | Convert a collection of text documents to a
matrix of token counts |
| ↳ Text Attribute | | String | - | Attribute in your dataset with text to vectorize |
| ↳ Tfidf Transformer | | Boolean | false | Transform a count matrix to a normalized tf or
tf-idf representation |
Output Ports
5.1.5.1.1.7 - Training: Extra Tree
Sklearn Training: Extra Tree Operator
Home > Machine Learning > Sklearn > Sklearn Training
| Property | Requirement | Type | Default | Description |
|---|
| Target Attribute | ✓ | String | - | Attribute in your dataset corresponding to target |
| Count Vectorizer | | Boolean | false | Convert a collection of text documents to a
matrix of token counts |
| ↳ Text Attribute | | String | - | Attribute in your dataset with text to vectorize |
| ↳ Tfidf Transformer | | Boolean | false | Transform a count matrix to a normalized tf or
tf-idf representation |
Output Ports
5.1.5.1.1.8 - Training: Extra Trees
Sklearn Training: Extra Trees Operator
Home > Machine Learning > Sklearn > Sklearn Training
| Property | Requirement | Type | Default | Description |
|---|
| Target Attribute | ✓ | String | - | Attribute in your dataset corresponding to target |
| Count Vectorizer | | Boolean | false | Convert a collection of text documents to a
matrix of token counts |
| ↳ Text Attribute | | String | - | Attribute in your dataset with text to vectorize |
| ↳ Tfidf Transformer | | Boolean | false | Transform a count matrix to a normalized tf or
tf-idf representation |
Output Ports
5.1.5.1.1.9 - Training: Gaussian Naive Bayes
Sklearn Training: Gaussian Naive Bayes Operator
Home > Machine Learning > Sklearn > Sklearn Training
| Property | Requirement | Type | Default | Description |
|---|
| Target Attribute | ✓ | String | - | Attribute in your dataset corresponding to target |
| Count Vectorizer | | Boolean | false | Convert a collection of text documents to a
matrix of token counts |
| ↳ Text Attribute | | String | - | Attribute in your dataset with text to vectorize |
| ↳ Tfidf Transformer | | Boolean | false | Transform a count matrix to a normalized tf or
tf-idf representation |
Output Ports
5.1.5.1.1.10 - Training: Gradient Boosting
Sklearn Training: Gradient Boosting Operator
Home > Machine Learning > Sklearn > Sklearn Training
| Property | Requirement | Type | Default | Description |
|---|
| Target Attribute | ✓ | String | - | Attribute in your dataset corresponding to target |
| Count Vectorizer | | Boolean | false | Convert a collection of text documents to a
matrix of token counts |
| ↳ Text Attribute | | String | - | Attribute in your dataset with text to vectorize |
| ↳ Tfidf Transformer | | Boolean | false | Transform a count matrix to a normalized tf or
tf-idf representation |
Output Ports
5.1.5.1.1.11 - Training: K-nearest Neighbors
Sklearn Training: K-nearest Neighbors Operator
Home > Machine Learning > Sklearn > Sklearn Training
| Property | Requirement | Type | Default | Description |
|---|
| Target Attribute | ✓ | String | - | Attribute in your dataset corresponding to target |
| Count Vectorizer | | Boolean | false | Convert a collection of text documents to a
matrix of token counts |
| ↳ Text Attribute | | String | - | Attribute in your dataset with text to vectorize |
| ↳ Tfidf Transformer | | Boolean | false | Transform a count matrix to a normalized tf or
tf-idf representation |
Output Ports
5.1.5.1.1.12 - Training: Linear Perceptron
Sklearn Training: Linear Perceptron Operator
Home > Machine Learning > Sklearn > Sklearn Training
| Property | Requirement | Type | Default | Description |
|---|
| Target Attribute | ✓ | String | - | Attribute in your dataset corresponding to target |
| Count Vectorizer | | Boolean | false | Convert a collection of text documents to a
matrix of token counts |
| ↳ Text Attribute | | String | - | Attribute in your dataset with text to vectorize |
| ↳ Tfidf Transformer | | Boolean | false | Transform a count matrix to a normalized tf or
tf-idf representation |
Output Ports
5.1.5.1.1.13 - Training: Linear Regression
Sklearn Training: Linear Regression Operator
Home > Machine Learning > Sklearn > Sklearn Training
| Property | Requirement | Type | Default | Description |
|---|
| Target Attribute | ✓ | String | - | Attribute in your dataset corresponding to target |
| Count Vectorizer | | Boolean | false | Convert a collection of text documents to a
matrix of token counts |
| ↳ Text Attribute | | String | - | Attribute in your dataset with text to vectorize |
| ↳ Tfidf Transformer | | Boolean | false | Transform a count matrix to a normalized tf or
tf-idf representation |
Output Ports
5.1.5.1.1.14 - Training: Linear Support Vector Machine
Sklearn Training: Linear Support Vector Machine Operator
Home > Machine Learning > Sklearn > Sklearn Training
| Property | Requirement | Type | Default | Description |
|---|
| Target Attribute | ✓ | String | - | Attribute in your dataset corresponding to target |
| Count Vectorizer | | Boolean | false | Convert a collection of text documents to a
matrix of token counts |
| ↳ Text Attribute | | String | - | Attribute in your dataset with text to vectorize |
| ↳ Tfidf Transformer | | Boolean | false | Transform a count matrix to a normalized tf or
tf-idf representation |
Output Ports
5.1.5.1.1.15 - Training: Logistic Regression
Sklearn Training: Logistic Regression Operator
Home > Machine Learning > Sklearn > Sklearn Training
| Property | Requirement | Type | Default | Description |
|---|
| Target Attribute | ✓ | String | - | Attribute in your dataset corresponding to target |
| Count Vectorizer | | Boolean | false | Convert a collection of text documents to a
matrix of token counts |
| ↳ Text Attribute | | String | - | Attribute in your dataset with text to vectorize |
| ↳ Tfidf Transformer | | Boolean | false | Transform a count matrix to a normalized tf or
tf-idf representation |
Output Ports
5.1.5.1.1.16 - Training: Logistic Regression Cross Validation
Sklearn Training: Logistic Regression Cross Validation Operator
Home > Machine Learning > Sklearn > Sklearn Training
| Property | Requirement | Type | Default | Description |
|---|
| Target Attribute | ✓ | String | - | Attribute in your dataset corresponding to target |
| Count Vectorizer | | Boolean | false | Convert a collection of text documents to a
matrix of token counts |
| ↳ Text Attribute | | String | - | Attribute in your dataset with text to vectorize |
| ↳ Tfidf Transformer | | Boolean | false | Transform a count matrix to a normalized tf or
tf-idf representation |
Output Ports
5.1.5.1.1.17 - Training: Multi-layer Perceptron
Sklearn Training: Multi-layer Perceptron Operator
Home > Machine Learning > Sklearn > Sklearn Training
| Property | Requirement | Type | Default | Description |
|---|
| Target Attribute | ✓ | String | - | Attribute in your dataset corresponding to target |
| Count Vectorizer | | Boolean | false | Convert a collection of text documents to a
matrix of token counts |
| ↳ Text Attribute | | String | - | Attribute in your dataset with text to vectorize |
| ↳ Tfidf Transformer | | Boolean | false | Transform a count matrix to a normalized tf or
tf-idf representation |
Output Ports
5.1.5.1.1.18 - Training: Multinomial Naive Bayes
Sklearn Training: Multinomial Naive Bayes Operator
Home > Machine Learning > Sklearn > Sklearn Training
| Property | Requirement | Type | Default | Description |
|---|
| Target Attribute | ✓ | String | - | Attribute in your dataset corresponding to target |
| Count Vectorizer | | Boolean | false | Convert a collection of text documents to a
matrix of token counts |
| ↳ Text Attribute | | String | - | Attribute in your dataset with text to vectorize |
| ↳ Tfidf Transformer | | Boolean | false | Transform a count matrix to a normalized tf or
tf-idf representation |
Output Ports
5.1.5.1.1.19 - Training: Nearest Centroid
Sklearn Training: Nearest Centroid Operator
Home > Machine Learning > Sklearn > Sklearn Training
| Property | Requirement | Type | Default | Description |
|---|
| Target Attribute | ✓ | String | - | Attribute in your dataset corresponding to target |
| Count Vectorizer | | Boolean | false | Convert a collection of text documents to a
matrix of token counts |
| ↳ Text Attribute | | String | - | Attribute in your dataset with text to vectorize |
| ↳ Tfidf Transformer | | Boolean | false | Transform a count matrix to a normalized tf or
tf-idf representation |
Output Ports
5.1.5.1.1.20 - Training: Passive Aggressive
Sklearn Training: Passive Aggressive Operator
Home > Machine Learning > Sklearn > Sklearn Training
| Property | Requirement | Type | Default | Description |
|---|
| Target Attribute | ✓ | String | - | Attribute in your dataset corresponding to target |
| Count Vectorizer | | Boolean | false | Convert a collection of text documents to a
matrix of token counts |
| ↳ Text Attribute | | String | - | Attribute in your dataset with text to vectorize |
| ↳ Tfidf Transformer | | Boolean | false | Transform a count matrix to a normalized tf or
tf-idf representation |
Output Ports
5.1.5.1.1.21 - Training: Probability Calibration
Sklearn Training: Probability Calibration Operator
Home > Machine Learning > Sklearn > Sklearn Training
| Property | Requirement | Type | Default | Description |
|---|
| Target Attribute | ✓ | String | - | Attribute in your dataset corresponding to target |
| Count Vectorizer | | Boolean | false | Convert a collection of text documents to a
matrix of token counts |
| ↳ Text Attribute | | String | - | Attribute in your dataset with text to vectorize |
| ↳ Tfidf Transformer | | Boolean | false | Transform a count matrix to a normalized tf or
tf-idf representation |
Output Ports
5.1.5.1.1.22 - Training: Random Forest
Sklearn Training: Random Forest Operator
Home > Machine Learning > Sklearn > Sklearn Training
| Property | Requirement | Type | Default | Description |
|---|
| Target Attribute | ✓ | String | - | Attribute in your dataset corresponding to target |
| Count Vectorizer | | Boolean | false | Convert a collection of text documents to a
matrix of token counts |
| ↳ Text Attribute | | String | - | Attribute in your dataset with text to vectorize |
| ↳ Tfidf Transformer | | Boolean | false | Transform a count matrix to a normalized tf or
tf-idf representation |
Output Ports
5.1.5.1.1.23 - Training: Ridge Regression
Sklearn Training: Ridge Regression Operator
Home > Machine Learning > Sklearn > Sklearn Training
| Property | Requirement | Type | Default | Description |
|---|
| Target Attribute | ✓ | String | - | Attribute in your dataset corresponding to target |
| Count Vectorizer | | Boolean | false | Convert a collection of text documents to a
matrix of token counts |
| ↳ Text Attribute | | String | - | Attribute in your dataset with text to vectorize |
| ↳ Tfidf Transformer | | Boolean | false | Transform a count matrix to a normalized tf or
tf-idf representation |
Output Ports
5.1.5.1.1.24 - Training: Ridge Regression Cross Validation
Sklearn Training: Ridge Regression Cross Validation Operator
Home > Machine Learning > Sklearn > Sklearn Training
| Property | Requirement | Type | Default | Description |
|---|
| Target Attribute | ✓ | String | - | Attribute in your dataset corresponding to target |
| Count Vectorizer | | Boolean | false | Convert a collection of text documents to a
matrix of token counts |
| ↳ Text Attribute | | String | - | Attribute in your dataset with text to vectorize |
| ↳ Tfidf Transformer | | Boolean | false | Transform a count matrix to a normalized tf or
tf-idf representation |
Output Ports
5.1.5.1.1.25 - Training: Stochastic Gradient Descent
Sklearn Training: Stochastic Gradient Descent Operator
Home > Machine Learning > Sklearn > Sklearn Training
| Property | Requirement | Type | Default | Description |
|---|
| Target Attribute | ✓ | String | - | Attribute in your dataset corresponding to target |
| Count Vectorizer | | Boolean | false | Convert a collection of text documents to a
matrix of token counts |
| ↳ Text Attribute | | String | - | Attribute in your dataset with text to vectorize |
| ↳ Tfidf Transformer | | Boolean | false | Transform a count matrix to a normalized tf or
tf-idf representation |
Output Ports
5.1.5.1.1.26 - Training: Support Vector Machine
Sklearn Training: Support Vector Machine Operator
Home > Machine Learning > Sklearn > Sklearn Training
| Property | Requirement | Type | Default | Description |
|---|
| Target Attribute | ✓ | String | - | Attribute in your dataset corresponding to target |
| Count Vectorizer | | Boolean | false | Convert a collection of text documents to a
matrix of token counts |
| ↳ Text Attribute | | String | - | Attribute in your dataset with text to vectorize |
| ↳ Tfidf Transformer | | Boolean | false | Transform a count matrix to a normalized tf or
tf-idf representation |
Output Ports
5.1.5.1.2 - Adaptive Boosting
Sklearn Adaptive Boosting Operator
Home > Machine Learning > Sklearn
| Property | Requirement | Type | Default | Description |
|---|
| Target Attribute | ✓ | String | - | Attribute in your dataset corresponding to target |
| Count Vectorizer | | Boolean | false | Convert a collection of text documents to a
matrix of token counts |
| ↳ Text Attribute | | String | - | Attribute in your dataset with text to vectorize |
| ↳ Tfidf Transformer | | Boolean | false | Transform a count matrix to a normalized tf or
tf-idf representation |
Output Ports
5.1.5.1.3 - Bagging
Sklearn Bagging Operator
Home > Machine Learning > Sklearn
| Property | Requirement | Type | Default | Description |
|---|
| Target Attribute | ✓ | String | - | Attribute in your dataset corresponding to target |
| Count Vectorizer | | Boolean | false | Convert a collection of text documents to a
matrix of token counts |
| ↳ Text Attribute | | String | - | Attribute in your dataset with text to vectorize |
| ↳ Tfidf Transformer | | Boolean | false | Transform a count matrix to a normalized tf or
tf-idf representation |
Output Ports
5.1.5.1.4 - Bernoulli Naive Bayes
Sklearn Bernoulli Naive Bayes Operator
Home > Machine Learning > Sklearn
| Property | Requirement | Type | Default | Description |
|---|
| Target Attribute | ✓ | String | - | Attribute in your dataset corresponding to target |
| Count Vectorizer | | Boolean | false | Convert a collection of text documents to a
matrix of token counts |
| ↳ Text Attribute | | String | - | Attribute in your dataset with text to vectorize |
| ↳ Tfidf Transformer | | Boolean | false | Transform a count matrix to a normalized tf or
tf-idf representation |
Output Ports
5.1.5.1.5 - Complement Naive Bayes
Sklearn Complement Naive Bayes Operator
Home > Machine Learning > Sklearn
| Property | Requirement | Type | Default | Description |
|---|
| Target Attribute | ✓ | String | - | Attribute in your dataset corresponding to target |
| Count Vectorizer | | Boolean | false | Convert a collection of text documents to a
matrix of token counts |
| ↳ Text Attribute | | String | - | Attribute in your dataset with text to vectorize |
| ↳ Tfidf Transformer | | Boolean | false | Transform a count matrix to a normalized tf or
tf-idf representation |
Output Ports
5.1.5.1.6 - Decision Tree
Sklearn Decision Tree Operator
Home > Machine Learning > Sklearn
| Property | Requirement | Type | Default | Description |
|---|
| Target Attribute | ✓ | String | - | Attribute in your dataset corresponding to target |
| Count Vectorizer | | Boolean | false | Convert a collection of text documents to a
matrix of token counts |
| ↳ Text Attribute | | String | - | Attribute in your dataset with text to vectorize |
| ↳ Tfidf Transformer | | Boolean | false | Transform a count matrix to a normalized tf or
tf-idf representation |
Output Ports
5.1.5.1.7 - Dummy Classifier
Sklearn Dummy Classifier Operator
Home > Machine Learning > Sklearn
| Property | Requirement | Type | Default | Description |
|---|
| Target Attribute | ✓ | String | - | Attribute in your dataset corresponding to target |
| Count Vectorizer | | Boolean | false | Convert a collection of text documents to a
matrix of token counts |
| ↳ Text Attribute | | String | - | Attribute in your dataset with text to vectorize |
| ↳ Tfidf Transformer | | Boolean | false | Transform a count matrix to a normalized tf or
tf-idf representation |
Output Ports
5.1.5.1.8 - Extra Tree
Sklearn Extra Tree Operator
Home > Machine Learning > Sklearn
| Property | Requirement | Type | Default | Description |
|---|
| Target Attribute | ✓ | String | - | Attribute in your dataset corresponding to target |
| Count Vectorizer | | Boolean | false | Convert a collection of text documents to a
matrix of token counts |
| ↳ Text Attribute | | String | - | Attribute in your dataset with text to vectorize |
| ↳ Tfidf Transformer | | Boolean | false | Transform a count matrix to a normalized tf or
tf-idf representation |
Output Ports
5.1.5.1.9 - Extra Trees
Sklearn Extra Trees Operator
Home > Machine Learning > Sklearn
| Property | Requirement | Type | Default | Description |
|---|
| Target Attribute | ✓ | String | - | Attribute in your dataset corresponding to target |
| Count Vectorizer | | Boolean | false | Convert a collection of text documents to a
matrix of token counts |
| ↳ Text Attribute | | String | - | Attribute in your dataset with text to vectorize |
| ↳ Tfidf Transformer | | Boolean | false | Transform a count matrix to a normalized tf or
tf-idf representation |
Output Ports
5.1.5.1.10 - Gaussian Naive Bayes
Sklearn Gaussian Naive Bayes Operator
Home > Machine Learning > Sklearn
| Property | Requirement | Type | Default | Description |
|---|
| Target Attribute | ✓ | String | - | Attribute in your dataset corresponding to target |
| Count Vectorizer | | Boolean | false | Convert a collection of text documents to a
matrix of token counts |
| ↳ Text Attribute | | String | - | Attribute in your dataset with text to vectorize |
| ↳ Tfidf Transformer | | Boolean | false | Transform a count matrix to a normalized tf or
tf-idf representation |
Output Ports
5.1.5.1.11 - Gradient Boosting
Sklearn Gradient Boosting Operator
Home > Machine Learning > Sklearn
| Property | Requirement | Type | Default | Description |
|---|
| Target Attribute | ✓ | String | - | Attribute in your dataset corresponding to target |
| Count Vectorizer | | Boolean | false | Convert a collection of text documents to a
matrix of token counts |
| ↳ Text Attribute | | String | - | Attribute in your dataset with text to vectorize |
| ↳ Tfidf Transformer | | Boolean | false | Transform a count matrix to a normalized tf or
tf-idf representation |
Output Ports
5.1.5.1.12 - K-nearest Neighbors
Sklearn K-nearest Neighbors Operator
Home > Machine Learning > Sklearn
| Property | Requirement | Type | Default | Description |
|---|
| Target Attribute | ✓ | String | - | Attribute in your dataset corresponding to target |
| Count Vectorizer | | Boolean | false | Convert a collection of text documents to a
matrix of token counts |
| ↳ Text Attribute | | String | - | Attribute in your dataset with text to vectorize |
| ↳ Tfidf Transformer | | Boolean | false | Transform a count matrix to a normalized tf or
tf-idf representation |
Output Ports
5.1.5.1.13 - Linear Perceptron
Sklearn Linear Perceptron Operator
Home > Machine Learning > Sklearn
| Property | Requirement | Type | Default | Description |
|---|
| Target Attribute | ✓ | String | - | Attribute in your dataset corresponding to target |
| Count Vectorizer | | Boolean | false | Convert a collection of text documents to a
matrix of token counts |
| ↳ Text Attribute | | String | - | Attribute in your dataset with text to vectorize |
| ↳ Tfidf Transformer | | Boolean | false | Transform a count matrix to a normalized tf or
tf-idf representation |
Output Ports
5.1.5.1.14 - Linear Regression
Sklearn Linear Regression Operator
Home > Machine Learning > Sklearn
| Property | Requirement | Type | Default | Description |
|---|
| Target Attribute | ✓ | String | - | Attribute in your dataset corresponding to target |
| Degree | ✓ | Integer | 1 | Degree of polynomial function |
Output Ports
5.1.5.1.15 - Linear Support Vector Machine
Sklearn Linear Support Vector Machine Operator
Home > Machine Learning > Sklearn
| Property | Requirement | Type | Default | Description |
|---|
| Target Attribute | ✓ | String | - | Attribute in your dataset corresponding to target |
| Count Vectorizer | | Boolean | false | Convert a collection of text documents to a
matrix of token counts |
| ↳ Text Attribute | | String | - | Attribute in your dataset with text to vectorize |
| ↳ Tfidf Transformer | | Boolean | false | Transform a count matrix to a normalized tf or
tf-idf representation |
Output Ports
5.1.5.1.16 - Logistic Regression
Sklearn Logistic Regression Operator
Home > Machine Learning > Sklearn
| Property | Requirement | Type | Default | Description |
|---|
| Target Attribute | ✓ | String | - | Attribute in your dataset corresponding to target |
| Count Vectorizer | | Boolean | false | Convert a collection of text documents to a
matrix of token counts |
| ↳ Text Attribute | | String | - | Attribute in your dataset with text to vectorize |
| ↳ Tfidf Transformer | | Boolean | false | Transform a count matrix to a normalized tf or
tf-idf representation |
Output Ports
5.1.5.1.17 - Logistic Regression Cross Validation
Sklearn Logistic Regression Cross Validation Operator
Home > Machine Learning > Sklearn
| Property | Requirement | Type | Default | Description |
|---|
| Target Attribute | ✓ | String | - | Attribute in your dataset corresponding to target |
| Count Vectorizer | | Boolean | false | Convert a collection of text documents to a
matrix of token counts |
| ↳ Text Attribute | | String | - | Attribute in your dataset with text to vectorize |
| ↳ Tfidf Transformer | | Boolean | false | Transform a count matrix to a normalized tf or
tf-idf representation |
Output Ports
5.1.5.1.18 - Multi-layer Perceptron
Sklearn Multi-layer Perceptron Operator
Home > Machine Learning > Sklearn
| Property | Requirement | Type | Default | Description |
|---|
| Target Attribute | ✓ | String | - | Attribute in your dataset corresponding to target |
| Count Vectorizer | | Boolean | false | Convert a collection of text documents to a
matrix of token counts |
| ↳ Text Attribute | | String | - | Attribute in your dataset with text to vectorize |
| ↳ Tfidf Transformer | | Boolean | false | Transform a count matrix to a normalized tf or
tf-idf representation |
Output Ports
5.1.5.1.19 - Multinomial Naive Bayes
Sklearn Multinomial Naive Bayes Operator
Home > Machine Learning > Sklearn
| Property | Requirement | Type | Default | Description |
|---|
| Target Attribute | ✓ | String | - | Attribute in your dataset corresponding to target |
| Count Vectorizer | | Boolean | false | Convert a collection of text documents to a
matrix of token counts |
| ↳ Text Attribute | | String | - | Attribute in your dataset with text to vectorize |
| ↳ Tfidf Transformer | | Boolean | false | Transform a count matrix to a normalized tf or
tf-idf representation |
Output Ports
5.1.5.1.20 - Nearest Centroid
Sklearn Nearest Centroid Operator
Home > Machine Learning > Sklearn
| Property | Requirement | Type | Default | Description |
|---|
| Target Attribute | ✓ | String | - | Attribute in your dataset corresponding to target |
| Count Vectorizer | | Boolean | false | Convert a collection of text documents to a
matrix of token counts |
| ↳ Text Attribute | | String | - | Attribute in your dataset with text to vectorize |
| ↳ Tfidf Transformer | | Boolean | false | Transform a count matrix to a normalized tf or
tf-idf representation |
Output Ports
5.1.5.1.21 - Passive Aggressive
Sklearn Passive Aggressive Operator
Home > Machine Learning > Sklearn
| Property | Requirement | Type | Default | Description |
|---|
| Target Attribute | ✓ | String | - | Attribute in your dataset corresponding to target |
| Count Vectorizer | | Boolean | false | Convert a collection of text documents to a
matrix of token counts |
| ↳ Text Attribute | | String | - | Attribute in your dataset with text to vectorize |
| ↳ Tfidf Transformer | | Boolean | false | Transform a count matrix to a normalized tf or
tf-idf representation |
Output Ports
5.1.5.1.22 - Probability Calibration
Sklearn Probability Calibration Operator
Home > Machine Learning > Sklearn
| Property | Requirement | Type | Default | Description |
|---|
| Target Attribute | ✓ | String | - | Attribute in your dataset corresponding to target |
| Count Vectorizer | | Boolean | false | Convert a collection of text documents to a
matrix of token counts |
| ↳ Text Attribute | | String | - | Attribute in your dataset with text to vectorize |
| ↳ Tfidf Transformer | | Boolean | false | Transform a count matrix to a normalized tf or
tf-idf representation |
Output Ports
5.1.5.1.23 - Random Forest
Sklearn Random Forest Operator
Home > Machine Learning > Sklearn
| Property | Requirement | Type | Default | Description |
|---|
| Target Attribute | ✓ | String | - | Attribute in your dataset corresponding to target |
| Count Vectorizer | | Boolean | false | Convert a collection of text documents to a
matrix of token counts |
| ↳ Text Attribute | | String | - | Attribute in your dataset with text to vectorize |
| ↳ Tfidf Transformer | | Boolean | false | Transform a count matrix to a normalized tf or
tf-idf representation |
Output Ports
5.1.5.1.24 - Ridge Regression
Sklearn Ridge Regression Operator
Home > Machine Learning > Sklearn
| Property | Requirement | Type | Default | Description |
|---|
| Target Attribute | ✓ | String | - | Attribute in your dataset corresponding to target |
| Count Vectorizer | | Boolean | false | Convert a collection of text documents to a
matrix of token counts |
| ↳ Text Attribute | | String | - | Attribute in your dataset with text to vectorize |
| ↳ Tfidf Transformer | | Boolean | false | Transform a count matrix to a normalized tf or
tf-idf representation |
Output Ports
5.1.5.1.25 - Ridge Regression Cross Validation
Sklearn Ridge Regression Cross Validation Operator
Home > Machine Learning > Sklearn
| Property | Requirement | Type | Default | Description |
|---|
| Target Attribute | ✓ | String | - | Attribute in your dataset corresponding to target |
| Count Vectorizer | | Boolean | false | Convert a collection of text documents to a
matrix of token counts |
| ↳ Text Attribute | | String | - | Attribute in your dataset with text to vectorize |
| ↳ Tfidf Transformer | | Boolean | false | Transform a count matrix to a normalized tf or
tf-idf representation |
Output Ports
5.1.5.1.26 - Sklearn Prediction
Sklearn Prediction Operator
Home > Machine Learning > Sklearn
| Property | Requirement | Type | Default | Description |
|---|
| Model Attribute | ✓ | String | model | Attribute corresponding to ML model |
| Output Attribute Name | ✓ | String | prediction | Attribute name of the prediction result |
| Ground Truth Attribute Name To Ignore | | String | - | Attribute name of the ground truth |
Output Ports
5.1.5.1.27 - Sklearn Testing
It will generate scorers for Sklearn model
Home > Machine Learning > Sklearn
| Property | Requirement | Type | Default | Description |
|---|
| Regression | ✓ | Boolean | false | Choose to solve a regression task |
| Model Attribute | ✓ | String | model | Attribute corresponding to ML model |
| Target Attribute | ✓ | String | - | Attribute in your dataset corresponding to target |
Output Ports
5.1.5.1.28 - Stochastic Gradient Descent
Sklearn Stochastic Gradient Descent Operator
Home > Machine Learning > Sklearn
| Property | Requirement | Type | Default | Description |
|---|
| Target Attribute | ✓ | String | - | Attribute in your dataset corresponding to target |
| Count Vectorizer | | Boolean | false | Convert a collection of text documents to a
matrix of token counts |
| ↳ Text Attribute | | String | - | Attribute in your dataset with text to vectorize |
| ↳ Tfidf Transformer | | Boolean | false | Transform a count matrix to a normalized tf or
tf-idf representation |
Output Ports
5.1.5.1.29 - Support Vector Machine
Sklearn Support Vector Machine Operator
Home > Machine Learning > Sklearn
| Property | Requirement | Type | Default | Description |
|---|
| Target Attribute | ✓ | String | - | Attribute in your dataset corresponding to target |
| Count Vectorizer | | Boolean | false | Convert a collection of text documents to a
matrix of token counts |
| ↳ Text Attribute | | String | - | Attribute in your dataset with text to vectorize |
| ↳ Tfidf Transformer | | Boolean | false | Transform a count matrix to a normalized tf or
tf-idf representation |
Output Ports
5.1.5.2 - Advanced Sklearn
Operators in the Advanced Sklearn category
Home > Machine Learning > Advanced Sklearn
Operators
Total: 4 operators
5.1.5.2.1 - KNN Classifier
Sklearn KNN Classifier Operator
Home > Machine Learning > Advanced Sklearn
| Property | Requirement | Type | Default | Description |
|---|
| Parameter Setting | ✓ | SklearnAdvancedKNNParameters | - | |
| Ground Truth Attribute Column | ✓ | String | - | Ground truth attribute column |
| Selected Features | ✓ | List | - | Features used to train the model |
Output Ports
5.1.5.2.2 - KNN Regressor
Sklearn KNN Regressor Operator
Home > Machine Learning > Advanced Sklearn
| Property | Requirement | Type | Default | Description |
|---|
| Parameter Setting | ✓ | SklearnAdvancedKNNParameters | - | |
| Ground Truth Attribute Column | ✓ | String | - | Ground truth attribute column |
| Selected Features | ✓ | List | - | Features used to train the model |
Output Ports
5.1.5.2.3 - SVM Classifier
Sklearn SVM Classifier Operator
Home > Machine Learning > Advanced Sklearn
| Property | Requirement | Type | Default | Description |
|---|
| Parameter Setting | ✓ | SklearnAdvancedSVCParameters | - | |
| Ground Truth Attribute Column | ✓ | String | - | Ground truth attribute column |
| Selected Features | ✓ | List | - | Features used to train the model |
Output Ports
5.1.5.2.4 - SVM Regressor
Sklearn SVM Regressor Operator
Home > Machine Learning > Advanced Sklearn
| Property | Requirement | Type | Default | Description |
|---|
| Parameter Setting | ✓ | SklearnAdvancedSVRParameters | - | |
| Ground Truth Attribute Column | ✓ | String | - | Ground truth attribute column |
| Selected Features | ✓ | List | - | Features used to train the model |
Output Ports
5.1.5.3 - Hugging Face
Operators in the Hugging Face category
Home > Machine Learning > Hugging Face
Operators
Total: 4 operators
5.1.5.3.1 - Hugging Face Iris Logistic Regression
Predict whether an iris is an Iris-setosa using a pre-trained logistic regression model
Home > Machine Learning > Hugging Face
| Property | Requirement | Type | Default | Description |
|---|
| Petal Length Cm Attribute | ✓ | String | - | Attribute in your dataset corresponding to
PetalLengthCm |
| Petal Width Cm Attribute | ✓ | String | - | Attribute in your dataset corresponding to
PetalWidthCm |
| Prediction Class Name | ✓ | String | Species_prediction | Output attribute name for the predicted class of
species |
| Prediction Probability Name | ✓ | String | Species_probability | Output attribute name for the prediction’s
probability of being a Iris-setosa |
Output Ports
5.1.5.3.2 - Hugging Face Sentiment Analysis
Analyzing Sentiments with a Twitter-Based Model from Hugging Face
Home > Machine Learning > Hugging Face
| Property | Requirement | Type | Default | Description |
|---|
| Attribute | ✓ | String | - | Column to perform sentiment analysis on |
| Positive Result Attribute | ✓ | String | huggingface_sentiment_positive | Column name of the sentiment analysis result
(positive) |
| Neutral Result Attribute | ✓ | String | huggingface_sentiment_neutral | Column name of the sentiment analysis result
(neutral) |
| Negative Result Attribute | ✓ | String | huggingface_sentiment_negative | Column name of the sentiment analysis result
(negative) |
Output Ports
5.1.5.3.3 - Hugging Face Spam Detection
Spam Detection by SMS Spam Detection Model from Hugging Face
Home > Machine Learning > Hugging Face
| Property | Requirement | Type | Default | Description |
|---|
| Attribute | ✓ | String | - | Column to perform spam detection on |
| Spam Result Attribute | ✓ | String | is_spam | Column name of whether spam or not |
| Score Result Attribute | ✓ | String | score | Column name of Probability for classification |
Output Ports
5.1.5.3.4 - Hugging Face Text Summarization
Summarize the given text content with a mini2bert pre-trained model from Hugging Face
Home > Machine Learning > Hugging Face
| Property | Requirement | Type | Default | Description |
|---|
| Attribute | ✓ | String | - | Attribute to perform text summarization on |
| Result Attribute Name | | String | summary | Attribute name of the text summary result |
Output Ports
5.1.5.4 - Machine Learning General
Operators in the Machine Learning General category
Home > Machine Learning > Machine Learning General
Operators
Total: 1 operator
5.1.5.4.1 - Machine Learning Scorer
Scorer for machine learning models
Home > Machine Learning > Machine Learning General
| Property | Requirement | Type | Default | Description |
|---|
| Regression | ✓ | Boolean | false | Choose to solve a regression task |
| ↳ Scorer Functions | | List | - | Select classification tasks metrics |
| ↳ Scorer Functions | | List | - | Select regression tasks metrics |
| Actual Value | ✓ | String | - | Specify the label attribute |
| Predicted Value | ✓ | String | - | Specify the attribute generated by the model |
Output Ports
5.1.6 - Utilities
Operators in the Utilities category
Home > Utilities
Operators
| Operator | Description |
|---|
| Random K Sampling | Random sampling with given percentage |
| Reservoir Sampling | Reservoir Sampling with k items being kept randomly |
| Split | Split data to two different ports |
| Unnest String | Unnest the string values in the column separated by a delimiter to multiple values |
Total: 4 operators
5.1.6.1 - Random K Sampling
Random sampling with given percentage
Home > Utilities
| Property | Requirement | Type | Default | Description |
|---|
| Random K Sample Percentage | ✓ | Integer | 0 | Random k sampling with given percentage |
Output Ports
5.1.6.2 - Reservoir Sampling
Reservoir Sampling with k items being kept randomly
Home > Utilities
| Property | Requirement | Type | Default | Description |
|---|
| Number Of Item Sampled In Reservoir Sampling | ✓ | Integer | 0 | Reservoir sampling with k items being kept
randomly |
Output Ports
5.1.6.3 - Split
Split data to two different ports
Home > Utilities
| Property | Requirement | Type | Default | Description |
|---|
| Split Percentage | | Integer | 80 | Percentage of data going to the upper port |
| Auto-Generate Seed | | Boolean | true | Shuffle the data based on a random seed |
| ↳ Seed | | Integer | 1 | An int for reproducible output across multiple
runs |
Output Ports
5.1.6.4 - Unnest String
Unnest the string values in the column separated by a delimiter to multiple values
Home > Utilities
| Property | Requirement | Type | Default | Description |
|---|
| Delimiter | ✓ | String | , | String that separates the data |
| Attribute | ✓ | String | - | Column of the string to unnest |
| Result Attribute | ✓ | String | unnestResult | Column name of the unnest result |
Output Ports
5.1.7 - External API
Operators in the External API category
Home > External API
Operators
Total: 4 operators
5.1.7.1 - Reddit Search
Search for recent posts with python-wrapped Reddit API, PRAW
Home > External Api
| Property | Requirement | Type | Default | Description |
|---|
| Client Id | ✓ | String | - | Client id that uses to access Reddit API |
| Client Secret | ✓ | String | - | Client secret that uses to access Reddit API |
| Query | ✓ | String | - | Search query |
| Limit | ✓ | Integer | 100 | Up to 1000 |
| Sorting | ✓ | none, controversial, gilded, hot, new,
rising, top | none | The sorting method, hot, new, etc |
Output Ports
5.1.7.2 - Twitter Full Archive Search API
Retrieve data from Twitter Full Archive Search API
Home > External Api
| Property | Requirement | Type | Default | Description |
|---|
| API Key | ✓ | String | - | |
| API Secret Key | ✓ | String | - | |
| Stop Upon Rate Limit | ✓ | Boolean | false | Stop when hitting rate limit? |
| Search Query | ✓ | String | - | Up to 1024 characters (Limited By Twitter) |
| From Datetime | ✓ | String | 2021-04-01T00:00:00Z | ISO 8601 format |
| To Datetime | ✓ | String | 2021-05-01T00:00:00Z | ISO 8601 format |
| Limit | ✓ | Integer | 100 | Maximum number of tweets to retrieve |
Output Ports
5.1.7.3 - Twitter Search API
Retrieve data from Twitter Search API
Home > External Api
| Property | Requirement | Type | Default | Description |
|---|
| API Key | ✓ | String | - | |
| API Secret Key | ✓ | String | - | |
| Stop Upon Rate Limit | ✓ | Boolean | false | Stop when hitting rate limit? |
| Search Query | ✓ | String | - | Up to 1024 characters (Limited by Twitter) |
| Limit | ✓ | Integer | 100 | Maximum number of tweets to retrieve |
Output Ports
5.1.7.4 - URL Fetcher
Fetch the content of a single URL
Home > External Api
| Property | Requirement | Type | Default | Description |
|---|
| URL | ✓ | String | - | Only accepts standard URL format |
| Decoding | ✓ | UTF-8, RAW BYTES | - | The decoding method for the url content |
Output Ports
5.1.8 - User-defined Functions
Operators in the User-defined Functions category
Home > User-defined Functions
Subcategories
5.1.8.1 - Python
Operators in the Python category
Home > User-defined Functions > Python
Operators
Total: 5 operators
5.1.8.1.1 - 1-out Python UDF
User-defined function operator in Python script
Home > User Defined Functions > Python
| Property | Requirement | Type | Default | Description |
|---|
| Python script | ✓ | Code (python) | See template below | Input your code here |
| Worker count | ✓ | Integer | 1 | Specify how many parallel workers to launch |
| Columns | | List | - | The columns of the source |
| ↳ Attribute Name | ✓ | String | - | |
| ↳ Attribute Type | ✓ | string, integer, long, double, boolean,
timestamp, binary, large_binary | - | |
Default Code Template
Python script
# from pytexera import *
# class GenerateOperator(UDFSourceOperator):
#
#     @overrides
#
#     def produce(self) -> Iterator[Union[TupleLike, TableLike, None]]:
#         yield
Output Ports
5.1.8.1.2 - 2-in Python UDF
User-defined function operator in Python script
Home > User Defined Functions > Python
| Property | Requirement | Type | Default | Description |
|---|
| Python script | ✓ | Code (python) | See template below | Input your code here |
| Worker count | ✓ | Integer | 1 | Specify how many parallel workers to launch |
| Retain input columns | ✓ | Boolean | true | Keep the original input columns? |
| Extra output column(s) | | List | - | Name of the newly added output columns that the
UDF will produce, if any |
| ↳ Attribute Name | ✓ | String | - | |
| ↳ Attribute Type | ✓ | string, integer, long, double, boolean,
timestamp, binary, large_binary | - | |
Default Code Template
Python script
# Choose from the following templates:
#
# from pytexera import *
#
# class ProcessTupleOperator(UDFOperatorV2):
#
#     @overrides
#     def process_tuple(self, tuple_: Tuple, port: int) -> Iterator[Optional[TupleLike]]:
#         yield tuple_
#
# class ProcessBatchOperator(UDFBatchOperator):
#     BATCH_SIZE = 10 # must be a positive integer
#
#     @overrides
#     def process_batch(self, batch: Batch, port: int) -> Iterator[Optional[BatchLike]]:
#         yield batch
#
# class ProcessTableOperator(UDFTableOperator):
#
#     @overrides
#     def process_table(self, table: Table, port: int) -> Iterator[Optional[TableLike]]:
#         yield table
Output Ports
5.1.8.1.3 - Python Lambda Function
Modify or add a new column with more ease
Home > User Defined Functions > Python
| Property | Requirement | Type | Default | Description |
|---|
| Add/Modify column(s) | | List | - | |
| ↳ Attribute Name | ✓ | String | - | |
| ↳ Expression | ✓ | String | - | |
| ↳ Attribute Type | ✓ | string, integer, long, double, boolean,
timestamp, binary, large_binary | - | |
Output Ports
5.1.8.1.4 - Python Table Reducer
Reduce Table to Tuple
Home > User Defined Functions > Python
| Property | Requirement | Type | Default | Description |
|---|
| Output columns | | List | - | |
| ↳ Attribute Name | ✓ | String | - | |
| ↳ Expression | ✓ | String | - | |
| ↳ Attribute Type | ✓ | string, integer, long, double, boolean,
timestamp, binary, large_binary | - | |
Output Ports
5.1.8.1.5 - Python UDF
User-defined function operator in Python script
Home > User Defined Functions > Python
| Property | Requirement | Type | Default | Description |
|---|
| Python script | ✓ | Code (python) | See template below | Input your code here |
| Worker count | ✓ | Integer | 1 | Specify how many parallel workers to launch |
| Retain input columns | ✓ | Boolean | true | Keep the original input columns? |
| Extra output column(s) | | List | - | Name of the newly added output columns that the
UDF will produce, if any |
| ↳ Attribute Name | ✓ | String | - | |
| ↳ Attribute Type | ✓ | string, integer, long, double, boolean,
timestamp, binary, large_binary | - | |
Default Code Template
Python script
# Choose from the following templates:
#
# from pytexera import *
#
# class ProcessTupleOperator(UDFOperatorV2):
#
#     @overrides
#     def process_tuple(self, tuple_: Tuple, port: int) -> Iterator[Optional[TupleLike]]:
#         yield tuple_
#
# class ProcessBatchOperator(UDFBatchOperator):
#     BATCH_SIZE = 10 # must be a positive integer
#
#     @overrides
#     def process_batch(self, batch: Batch, port: int) -> Iterator[Optional[BatchLike]]:
#         yield batch
#
# class ProcessTableOperator(UDFTableOperator):
#
#     @overrides
#     def process_table(self, table: Table, port: int) -> Iterator[Optional[TableLike]]:
#         yield table
Output Ports
5.1.8.2 - Java
Operators in the Java category
Home > User-defined Functions > Java
Operators
| Operator | Description |
|---|
| Java UDF | User-defined function operator in Java script |
Total: 1 operator
5.1.8.2.1 - Java UDF
User-defined function operator in Java script
Home > User Defined Functions > Java
| Property | Requirement | Type | Default | Description |
|---|
| Java UDF script | ✓ | Code (java) | See template below | Input your code here |
| Worker count | ✓ | Integer | 1 | Specify how many parallel workers to launch |
| Retain input columns | ✓ | Boolean | true | Keep the original input columns? |
| Extra output column(s) | | List | - | Name of the newly added output columns that the
UDF will produce, if any |
| ↳ Attribute Name | ✓ | String | - | |
| ↳ Attribute Type | ✓ | string, integer, long, double, boolean,
timestamp, binary, large_binary | - | |
Default Code Template
Java UDF script
import org.apache.texera.amber.operator.map.MapOpExec;
import org.apache.texera.amber.core.tuple.Tuple;
import org.apache.texera.amber.core.tuple.TupleLike;
import scala.Function1;
import java.io.Serializable;

public class JavaUDFOpExec extends MapOpExec {
    public JavaUDFOpExec () {
        this.setMapFunc((Function1<Tuple, TupleLike> & Serializable) this::processTuple);
    }

    public TupleLike processTuple(Tuple tuple) {
        return tuple;
    }
}
Output Ports
5.1.8.3 - R
Operators in the R category
Home > User-defined Functions > R
Operators
| Operator | Description |
|---|
| R UDF | User-defined function operator in R script |
| 1-out R UDF | User-defined function operator in R script |
Total: 2 operators
5.1.8.3.1 - 1-out R UDF
User-defined function operator in R script
Home > User Defined Functions > R
| Property | Requirement | Type | Default | Description |
|---|
| R Source UDF Script | ✓ | Code (r) | See template below | Input your code here |
| Worker count | ✓ | Integer | 1 | Specify how many parallel workers to launch |
| Use Tuple API? | ✓ | Boolean | false | Check this box to use Tuple API, leave unchecked
to use Table API |
| Columns | | List | - | The columns of the source |
| ↳ Attribute Name | ✓ | String | - | |
| ↳ Attribute Type | ✓ | string, integer, long, double, boolean,
timestamp, binary, large_binary | - | |
Default Code Template
R Source UDF Script
# If using Table API:
# function() {
#   return (data.frame(Column_Here = "Value_Here"))
# }

# If using Tuple API:
# library(coro)
# coro::generator(function() {
#   yield (list(text= "hello world!"))
# })
Output Ports
5.1.8.3.2 - R UDF
User-defined function operator in R script
Home > User Defined Functions > R
| Property | Requirement | Type | Default | Description |
|---|
| R UDF Script | ✓ | Code (r) | See template below | Input your code here |
| Worker count | ✓ | Integer | 1 | Specify how many parallel workers to launch |
| Use Tuple API? | ✓ | Boolean | false | Check this box to use Tuple API, leave unchecked
to use Table API |
| Retain input columns | ✓ | Boolean | true | Keep the original input columns? |
| Extra output column(s) | | List | - | Name of the newly added output columns that the
UDF will produce, if any |
| ↳ Attribute Name | ✓ | String | - | |
| ↳ Attribute Type | ✓ | string, integer, long, double, boolean,
timestamp, binary, large_binary | - | |
Default Code Template
R UDF Script
# If using Table API:
# function(table, port) {
#   return (table)
# }

# If using Tuple API:
# library(coro)
# coro::generator(function(tuple, port) {
#   yield (tuple)
# })
Output Ports
5.1.9 - Visualization
Operators in the Visualization category
Home > Visualization
Subcategories
Operators
| Operator | Description |
|---|
| Nested Table | Visualize Data in a Depth Two Nested Table |
Total: 1 operator
5.1.9.1 - Basic
Operators in the Basic category
Home > Visualization > Basic
Operators
| Operator | Description |
|---|
| Bar Chart | Visualize data in a Bar Chart |
| Bubble Chart | A 3D Scatter Plot; Bubbles are graphed using x and y labels, and their sizes determined by a z-value. |
| Dot Plot | Visualize data using a dot plot |
| Dumbbell Plot | Visualize data in a Dumbbell Plot. A dumbbell plot (also known as a lollipop chart) is typically used to compare two distinct values or time points for the same entity. |
| Figure Factory Table | Visualize data in a figure factory table |
| Filled Area Plot | Visualize data in a filled area plot |
| Gantt Chart | A Gantt chart is a type of bar chart that illustrates a project schedule. The chart lists the tasks to be performed on the vertical axis, and time intervals on the horizontal axis. The width of the horizontal bars in the graph shows the duration of each activity. |
| Hierarchy Chart | Visualize data in hierarchy |
| Icicle Chart | Visualize hierarchical data from root to leaves |
| Line Chart | View the result in line chart |
| Pie Chart | Visualize data in a Pie Chart |
| Range Slider | Visualize data in a Range Slider |
| Sankey Diagram | Visualize data using a Sankey diagram |
| Scatter Plot | View the result in a scatterplot |
| Tables Plot | Visualize data in a table chart. |
| Time Series Plot | Visualize trends and patterns over time. |
Total: 16 operators
5.1.9.1.1 - Bar Chart
Visualize data in a Bar Chart
Home > Visualization > Basic
| Property | Requirement | Type | Default | Description |
|---|
| Fields | ✓ | String | - | Visualize categorical data in a Bar Chart |
| Category Column | | String | No Selection | Optional - Select a column to Color Code the
Categories |
| Horizontal Orientation | | Boolean | false | Orientation Style |
| Pattern | | String | - | Add texture to the chart based on an attribute |
| Value Column | ✓ | String (integer, long, double) | - | The value associated with each category |
Output Ports
5.1.9.1.2 - Bubble Chart
A 3D Scatter Plot; Bubbles are graphed using x and y labels, and their sizes determined by a z-value.
Home > Visualization > Basic
| Property | Requirement | Type | Default | Description |
|---|
| X-Column | ✓ | String | - | Data column for the x-axis |
| Y-Column | ✓ | String | - | Data column for the y-axis |
| Z-Column | ✓ | String | - | Data column to determine bubble size |
| Enable Color | | Boolean | false | Colors bubbles using a data column |
| Color-Column | ✓ | String | - | Picks data column to color bubbles with if color
is enabled |
Output Ports
5.1.9.1.3 - Dot Plot
Visualize data using a dot plot
Home > Visualization > Basic
| Property | Requirement | Type | Default | Description |
|---|
| Count Attribute | ✓ | String | - | The attribute for the counting of the dot plot |
Output Ports
5.1.9.1.4 - Dumbbell Plot
Visualize data in a Dumbbell Plot. A dumbbell plot (also known as a lollipop chart) is typically used to compare two distinct values or time points for the same entity.
Home > Visualization > Basic
| Property | Requirement | Type | Default | Description |
|---|
| Category Column Name | ✓ | String | - | The name of the category column |
| Dumbbell Start Value | ✓ | String | - | The start point value of each dumbbell |
| Dumbbell End Value | ✓ | String | - | The end value of each dumbbell |
| Measurement Column Name | ✓ | String (integer, long, double) | - | The name of the measurement column |
| Compared Column Name | ✓ | String | - | The column name that is being compared |
| Dots | | List | - | |
| ↳ Dot Column Value | ✓ | String (integer, long, double) | - | Value for dot axis |
| Show Legends? | | Boolean | false | Whether to show legends in the graph |
Output Ports
5.1.9.1.5 - Figure Factory Table
Visualize data in a figure factory table
Home > Visualization > Basic
| Property | Requirement | Type | Default | Description |
|---|
| Font Size | | Double | 12 | Font size of the Figure Factory Table |
| Font Color (Hex Code) | | String | #000000 | Font color of the Figure Factory Table |
| Row Height | | Double | 30 | Row height of the Figure Factory Table |
| Add Attribute | ✓ | List | [1 items] | List of columns to include in the figure factory
table |
| ↳ Attribute Name | ✓ | String | - | |
Output Ports
5.1.9.1.6 - Filled Area Plot
Visualize data in a filled area plot
Home > Visualization > Basic
| Property | Requirement | Type | Default | Description |
|---|
| X-axis Attribute | ✓ | String | - | The attribute for your x-axis |
| Y-axis Attribute | ✓ | String | - | The attribute for your y-axis |
| Line Group | | String | - | The attribute for group of each line |
| Color | | String | - | Choose an attribute to color the plot |
| Split Plot by Line Group | ✓ | Boolean | false | Do you want to split the graph |
| Pattern | | String | - | Add texture to the chart based on an attribute |
Output Ports
5.1.9.1.7 - Gantt Chart
A Gantt chart is a type of bar chart that illustrates a project schedule. The chart lists the tasks to be performed on the vertical axis, and time intervals on the horizontal axis. The width of the horizontal bars in the graph shows the duration of each activity.
Home > Visualization > Basic
| Property | Requirement | Type | Default | Description |
|---|
| Pattern | | String | - | Add texture to the chart based on an attribute |
| Start Datetime Column | ✓ | String (timestamp) | - | The start timestamp of the task |
| Finish Datetime Column | ✓ | String (timestamp) | - | The end timestamp of the task |
| Task Column | ✓ | String | - | The name of the task |
| Color Column | | String | - | Column to color tasks |
Output Ports
5.1.9.1.8 - Hierarchy Chart
Visualize data in hierarchy
Home > Visualization > Basic
| Property | Requirement | Type | Default | Description |
|---|
| Chart Type | ✓ | treemap, sunburst | - | Treemap or Sunburst |
| Hierarchy Path | ✓ | List | - | Hierarchy of attributes from a higher-level
category to lower-level category |
| ↳ Attribute Name | ✓ | String | - | |
| Value Column | ✓ | String (integer, long, double) | - | The value associated with the size of each sector
in the chart |
Output Ports
5.1.9.1.9 - Icicle Chart
Visualize hierarchical data from root to leaves
Home > Visualization > Basic
| Property | Requirement | Type | Default | Description |
|---|
| Hierarchy Path | ✓ | List | - | Hierarchy of attributes from a root (higher-level
category) to leaves (lower-level category) |
| ↳ Attribute Name | ✓ | String | - | |
| Value Column | ✓ | String (integer, long, double) | - | The value associated with the size of each sector
in the chart |
Output Ports
5.1.9.1.10 - Line Chart
View the result in line chart
Home > Visualization > Basic
| Property | Requirement | Type | Default | Description |
|---|
| Y Label | | String | Y Axis | The label for y axis |
| X Label | | String | X Axis | The label for x axis |
| Lines | ✓ | List | - | |
| ↳ Y Value | ✓ | String | - | Value for y axis |
| ↳ X Value | ✓ | String | - | Value for x axis |
| ↳ Line Mode | ✓ | line, dots, line with dots | line with dots | |
| ↳ Line Name | | String | - | |
| ↳ Line Color | | String | - | Must be a valid CSS color or hex color string |
Output Ports
5.1.9.1.11 - Pie Chart
Visualize data in a Pie Chart
Home > Visualization > Basic
| Property | Requirement | Type | Default | Description |
|---|
| Value Column | ✓ | String (integer, long, double) | - | The value associated with slice of pie |
| Name Column | ✓ | String | - | The name of the slice of pie |
Output Ports
5.1.9.1.12 - Range Slider
Visualize data in a Range Slider
Home > Visualization > Basic
| Property | Requirement | Type | Default | Description |
|---|
| Y-axis | ✓ | String | - | The name of the column to represent y-axis |
| X-axis | ✓ | String | - | The name of the column to represent the x-axis |
| Handle Duplicates | | Nothing, Mean, Sum | NOTHING | How to handle duplicate values in y-axis |
Output Ports
5.1.9.1.13 - Sankey Diagram
Visualize data using a Sankey diagram
Home > Visualization > Basic
| Property | Requirement | Type | Default | Description |
|---|
| Source Attribute | ✓ | String | - | The source node of the Sankey diagram |
| Target Attribute | ✓ | String | - | The target node of the Sankey diagram |
| Value Attribute | ✓ | String | - | The value/volume of the flow between source and
target |
Output Ports
5.1.9.1.14 - Scatter Plot
View the result in a scatterplot
Home > Visualization > Basic
| Property | Requirement | Type | Default | Description |
|---|
| X-Column | ✓ | String (integer, double) | - | X Column |
| Y-Column | ✓ | String (integer, double) | - | Y Column |
| Alpha Value | | Double | 1.0 | Alpha (opacity) value from 0.0 (transparent) to
1.0 (opaque) |
| Color-Column | | String | - | Dots will be assigned different colors based on
their values of this column |
| log scale X | | Boolean | false | Values in X-column is log-scaled |
| log scale Y | | Boolean | false | Values in Y-column is log-scaled |
| Hover column | | String | - | Column value to display when a dot is hovered over |
Output Ports
5.1.9.1.15 - Tables Plot
Visualize data in a table chart.
Home > Visualization > Basic
| Property | Requirement | Type | Default | Description |
|---|
| Add Attribute | ✓ | List| - | List of columns to include in the table chart | | ↳ Attribute Name | ✓ | String | - | |
Output Ports5.1.9.1.16 - Time Series PlotVisualize trends and patterns over time. Home > Visualization > Basic | Property | Requirement | Type | Default | Description |
|---|
| Time Column | ✓ | String | - | The column containing time/date values (e.g.,
Date, Timestamp) | | Value Column | ✓ | String | - | The numerical column to plot on the Y-axis (e.g.,
Sales, Temperature) | | Category Column | | String | No Selection | Optional - A categorical column to create
separate lines | | Facet Column | | String | No Selection | Optional - A column to create separate subplots | | Plot Type | ✓ | String | line | Select the type of time series plot (line, area) | | Show Range Slider | | Boolean | false | Display a range slider at the bottom of the plot |
Output Ports5.1.9.2 - StatisticalOperators in the Statistical category Home > Visualization > Statistical Operators| Operator | Description |
|---|
| Box/Violin Plot | Visualize data using either a Box Plot or a Violin Plot. Box plots are drawn as a box with a vertical line down the middle which is mean value, and has horizontal lines attached to each side (known as “whiskers”). Violin plots provide more detail by showing a smoothed density curve on each side, and also include a box plot inside for comparison. | | Continuous Error Bands | Visualize error or uncertainty along a continuous line | | Empirical Cumulative Distribution Plot | Visualize the empirical cumulative distribution of a numeric column. | | Histogram | Visualize data in a Histogram Chart | | Histogram2D | Displays a bivariate histogram as a density heatmap | | Scatter Matrix Chart | Visualize datasets in a Scatter Matrix | | Strip Chart | Visualize distribution of data points as a strip plot | | Tree Plot | Visualize hierarchical data as a top-down, interactive, auto-sizing tree |
Total: 8 operators 5.1.9.2.1 - Box/Violin PlotVisualize data using either a Box Plot or a Violin Plot. Box plots are drawn as a box with a vertical line down the middle which is mean value, and has horizontal lines attached to each side (known as “whiskers”). Violin plots provide more detail by showing a smoothed density curve on each side, and also include a box plot inside for comparison. Home > Visualization > Statistical | Property | Requirement | Type | Default | Description |
|---|
| Value Column | ✓ | String (integer, long, double) | - | Data column for box plot | | Quartile Method | ✓ | linear, inclusive, exclusive | linear | | | Horizontal Orientation | | Boolean | false | Orientation style | | Violin Plot | | Boolean | false | Check this box to overlay a violin plot on the
box plot; otherwise, show only the box plot |
Output Ports5.1.9.2.2 - Continuous Error BandsVisualize error or uncertainty along a continuous line Home > Visualization > Statistical | Property | Requirement | Type | Default | Description |
|---|
| X Label | | String | X Axis | Label used for x axis | | Y Label | | String | Y Axis | Label used for y axis | | Bands | ✓ | List | - | | | ↳ Y-Axis Upper Bound | ✓ | String | - | Represents upper bound error of y-values | | ↳ Y-Axis Lower Bound | ✓ | String | - | Represents lower bound error of y-values | | ↳ Fill Color | | String | - | Must be a valid CSS color or hex color string | | ↳ Y Value | ✓ | String | - | Value for y axis | | ↳ X Value | ✓ | String | - | Value for x axis | | ↳ Line Mode | ✓ | line, dots, line with dots | line with dots | | | ↳ Line Name | | String | - | | | ↳ Line Color | | String | - | Must be a valid CSS color or hex color string |
Output Ports5.1.9.2.3 - Empirical Cumulative Distribution PlotVisualize the empirical cumulative distribution of a numeric column. Home > Visualization > Statistical | Property | Requirement | Type | Default | Description |
|---|
| Value Column | ✓ | String (integer, long, double) | - | Numeric column used to compute the empirical
cumulative distribution | | Color Column | | String | - | Optional column for coloring ECDF lines by group | | Separate By Column | | String | - | Optional column for splitting ECDF plots into
subplots | | Y Axis Mode | | String | probability | Display cumulative probability, raw count, or
cumulative sum | | CDF Mode | | String | standard | ‘standard’ shows P(X ≤ x), ‘reversed’ shows P(X ≥
x), ‘complementary’ shows 1 - P(X ≤ x) | | Orientation | | String | vertical | Plot ECDF vertically or horizontally | | Show Markers | | Boolean | false | Display sample markers on the ECDF line | | Marginal Plot | | String | none | Optional marginal plot to display alongside the
ECDF |
Output Ports5.1.9.2.4 - HistogramVisualize data in a Histogram Chart Home > Visualization > Statistical | Property | Requirement | Type | Default | Description |
|---|
| Color Column | | String | - | Column for differentiating data by its value | | SeparateBy Column | | String | - | Column for separating histogram chart by its value | | Distribution Type | | String | - | Distribution type (rug, box, violin) | | Pattern | | String | - | Add texture to the chart based on an attribute | | Value Column | ✓ | String | - | Column for counting values |
Output Ports5.1.9.2.5 - Histogram2DDisplays a bivariate histogram as a density heatmap Home > Visualization > Statistical | Property | Requirement | Type | Default | Description |
|---|
| X Column | ✓ | String | - | Numeric column for the X axis bins | | Y Column | ✓ | String | - | Numeric column for the Y axis bins | | X Bins | ✓ | Integer | 10 | Number of bins along the X axis (Default: 10) | | Y Bins | ✓ | Integer | 10 | Number of bins along the Y axis (Default: 10) | | Normalization | | density, probability, percent | density | Type of histogram normalization |
Output Ports5.1.9.2.6 - Scatter Matrix ChartVisualize datasets in a Scatter Matrix Home > Visualization > Statistical | Property | Requirement | Type | Default | Description |
|---|
| Selected Attributes | ✓ | List | - | The axes of each scatter plot in the matrix | | Color Column | ✓ | String | - | Column to color points |
Output Ports5.1.9.2.7 - Strip ChartVisualize distribution of data points as a strip plot Home > Visualization > Statistical | Property | Requirement | Type | Default | Description |
|---|
| X-Axis Column | ✓ | String | - | Column containing numeric values for the x-axis | | Y-Axis Column | ✓ | String | - | Column containing categorical values for the
y-axis | | Color By | | String | - | Optional - Color points by category | | Facet Column | | String | - | Optional - Create separate subplots for each
category |
Output Ports5.1.9.2.8 - Tree PlotVisualize hierarchical data as a top-down, interactive, auto-sizing tree Home > Visualization > Statistical | Property | Requirement | Type | Default | Description |
|---|
| Edge List Column | ✓ | String | - | Column with [parent, child] pairs |
Output Ports5.1.9.3 - ScientificOperators in the Scientific category Home > Visualization > Scientific OperatorsTotal: 14 operators 5.1.9.3.1 - Carpet PlotVisualize data in a Carpet Plot Home > Visualization > Scientific | Property | Requirement | Type | Default | Description |
|---|
| First Parameter Axis Column | ✓ | String | - | Column representing the first parameter axis (a) | | Second Parameter Axis Column | ✓ | String | - | Column representing the second parameter axis (b) | | Value Column | ✓ | String | - | Column representing the value at each (a, b)
coordinate |
Output Ports5.1.9.3.2 - Contour PlotDisplays terrain or gradient variations in a Contour Plot Home > Visualization > Scientific | Property | Requirement | Type | Default | Description |
|---|
| Grid Size | | String | 10 | Grid resolution of the final image | | Connect Gaps | | Boolean | true | Automatically fill in the missing parts | | x | ✓ | String | - | The column name of X-axis | | y | ✓ | String | - | The column name of Y-axis | | z | ✓ | String | - | The column name of color bar | | Coloring Method | | heatmap, lines, none | heatmap | |
Output Ports5.1.9.3.3 - DendrogramVisualize data in a Dendrogram Home > Visualization > Scientific | Property | Requirement | Type | Default | Description |
|---|
| Color Threshold | | String | - | Value at which separation of clusters will be made | | Value X Column | ✓ | String | - | The x values of points in dendrogram | | Value Y Column | ✓ | String | - | The y value of points in dendrogram | | Labels | ✓ | String | - | The label of points in dendrogram |
Output Ports5.1.9.3.4 - HeatmapVisualize data in a HeatMap Chart Home > Visualization > Scientific | Property | Requirement | Type | Default | Description |
|---|
| Value X Column | ✓ | String | - | The values along the x-axis | | Value Y Column | ✓ | String | - | The values along the y-axis | | Values | ✓ | String | - | The values of the heatmap |
Output Ports5.1.9.3.5 - Network GraphVisualize data in a network graph Home > Visualization > Scientific | Property | Requirement | Type | Default | Description |
|---|
| Source Column | ✓ | String | - | Source node for edge in graph | | Destination Column | ✓ | String | - | Destination node for edge in graph | | Title | | String | Network Graph | |
Output Ports5.1.9.3.6 - Parallel Coordinates PlotVisualize multivariate data using parallel coordinate axes Home > Visualization > Scientific | Property | Requirement | Type | Default | Description |
|---|
| Dimensions | ✓ | List | - | List of numeric columns to visualize as parallel
axes (min: 1, At least one dimension is required) | | Color Column | | String | - | Column used to color or group the lines |
Output Ports5.1.9.3.7 - Polar ChartDisplays data points in a polar scatter plot Home > Visualization > Scientific | Property | Requirement | Type | Default | Description |
|---|
| r | ✓ | String | - | The column name for radial values (must be
numeric) | | theta | ✓ | String | - | The column name for angular values (must be
numeric) |
Output Ports5.1.9.3.8 - Quiver PlotVisualize vector data in a Quiver Plot Home > Visualization > Scientific | Property | Requirement | Type | Default | Description |
|---|
| x | ✓ | String | - | Column for the x-coordinate of the starting point | | y | ✓ | String | - | Column for the y-coordinate of the starting point | | u | ✓ | String | - | Column for the vector component in the x-direction | | v | ✓ | String | - | Column for the vector component in the y-direction |
Output Ports5.1.9.3.9 - Radar ChartVisualize data in a Radar Chart Home > Visualization > Scientific | Property | Requirement | Type | Default | Description |
|---|
| Name Column | ✓ | String | - | Column containing entity names for each radar | | Value Columns | ✓ | List | - | Columns containing numeric values for radar chart
axes | | Fill Opacity | ✓ | Double | 0.5 | Opacity value for radar chart fill from 0.0
(transparent) to 1.0 (opaque) |
Output Ports5.1.9.3.10 - Radar PlotView the result in a radar plot. Home > Visualization > Scientific | Property | Requirement | Type | Default | Description |
|---|
| Axes | ✓ | List | - | Numeric columns to use as radar axes | | Trace Name Column | | String | No Selection | Optional - Select a column to use for naming each
radar trace | | Trace Color Column | | String | No Selection | Optional - Select a column to use for coloring
each radar trace (note: if there are too many
traces with distinct coloring values, colors may
repeat) | | Line Pattern | ✓ | solid, dash, dot | solid | Pattern of the lines connecting points on the
radar plot | | Max Normalize | ✓ | Boolean | true | Normalize radar plot values by scaling them
relative to the maximum value on their respective
axes | | Fill Trace | ✓ | Boolean | true | Fill the area within each radar trace | | Show Point Markers | ✓ | Boolean | true | Display point markers on the radar plot | | Show Legend | | Boolean | true | Display the legend (note: without the legend, you
are unable to selectively hide or show traces in
the plot) |
Output Ports5.1.9.3.11 - Ternary ContourShows how a measured value changes across all mixtures of three components that sum to a constant Home > Visualization > Scientific | Property | Requirement | Type | Default | Description |
|---|
| Variable 1 | ✓ | String | - | First variable data field | | Variable 2 | ✓ | String | - | Second variable data field | | Variable 3 | ✓ | String | - | Third variable data field | | Measured Value | ✓ | String | - | Measured value data field |
Output Ports5.1.9.3.12 - Ternary PlotPoints are graphed on a Ternary Plot using 3 specified data fields Home > Visualization > Scientific | Property | Requirement | Type | Default | Description |
|---|
| Variable 1 | ✓ | String | - | First variable data field | | Variable 2 | ✓ | String | - | Second variable data field | | Variable 3 | ✓ | String | - | Third variable data field | | Categorize by Color | | Boolean | false | Optionally color points using a data field | | Color Data Field | | String | - | Specify the data field to color |
Output Ports5.1.9.3.13 - Volcano PlotDisplays statistical significance versus effect size Home > Visualization > Scientific | Property | Requirement | Type | Default | Description |
|---|
| Effect Size (log2 Fold Change) | ✓ | String | - | Select the column representing the effect size or
magnitude of change between two experimental
groups. This value is typically a log2 fold
change and is used for the x-axis of the volcano
plot | | P-Value Column | ✓ | String | - | Select the column representing the p-value
associated with the statistical test for each
feature. This value is transformed using
-log10(p-value) and plotted on the y-axis to
indicate statistical significance |
Output Ports5.1.9.3.14 - Wind Rose ChartDisplays wind distribution using a polar bar chart Home > Visualization > Scientific | Property | Requirement | Type | Default | Description |
|---|
| Radial Values (r) | ✓ | String | - | Numeric values representing magnitude (e.g.,
frequency) | | Angular Values (θ) | ✓ | String | - | Direction or angle categories (e.g., N, NE, E) | | Color Group | | String | - | Optional grouping column (e.g., wind strength) |
Output Ports5.1.9.4 - FinancialOperators in the Financial category Home > Visualization > Financial Operators| Operator | Description |
|---|
| Bullet Chart | Visualize data using a Bullet Chart that shows a primary quantitative bar and delta indicator.
Optional elements such as qualitative ranges (steps) and a performance threshold are displayed only when provided. | | Candlestick Chart | Visualize data in a Candlestick Chart | | Funnel Plot | Visualize data in a Funnel Plot | | Gauge Chart | Visualize a single value with a radial gauge chart, showing progress towards a goal with optional steps, threshold, and delta. | | Waterfall Chart | Visualize data as a waterfall chart |
Total: 5 operators 5.1.9.4.1 - Bullet ChartVisualize data using a Bullet Chart that shows a primary quantitative bar and delta indicator. Optional elements such as qualitative ranges (steps) and a performance threshold are displayed only when provided. Home > Visualization > Financial | Property | Requirement | Type | Default | Description |
|---|
| Value | ✓ | String | - | The actual value to display on the bullet chart | | Delta Reference | ✓ | String | - | The reference value for the delta indicator.
e.g., 100 | | Threshold Value | | String | - | The performance threshold value. e.g., 100 | | Steps | | List | [] | Optional: Each step includes a start and end
value e.g., 0, 100 | | ↳ Start | | String | - | | | ↳ End | | String | - | |
Output Ports5.1.9.4.2 - Candlestick ChartVisualize data in a Candlestick Chart Home > Visualization > Financial | Property | Requirement | Type | Default | Description |
|---|
| Date Column | ✓ | String | - | The date of the candlestick | | Opening Price Column | ✓ | String | - | The opening price of the candlestick | | Highest Price Column | ✓ | String | - | The highest price of the candlestick | | Lowest Price Column | ✓ | String | - | The lowest price of the candlestick | | Closing Price Column | ✓ | String | - | The closing price of the candlestick |
Output Ports5.1.9.4.3 - Funnel PlotVisualize data in a Funnel Plot Home > Visualization > Financial | Property | Requirement | Type | Default | Description |
|---|
| X Column | ✓ | String | - | Data column for the x-axis | | Y Column | ✓ | String | - | Data column for the y-axis | | Color Column | | String | - | Column to categorically colorize funnel sections |
Output Ports5.1.9.4.4 - Gauge ChartVisualize a single value with a radial gauge chart, showing progress towards a goal with optional steps, threshold, and delta. Home > Visualization > Financial | Property | Requirement | Type | Default | Description |
|---|
| Gauge Value | ✓ | String | - | The primary value displayed on the gauge chart | | Delta | | String | - | The baseline value used to calculate the delta
from the gauge value | | Threshold Value | | String | - | Defines a boundary or target value shown on the
gauge chart | | Steps | | List | - | List of step ranges for the gauge | | ↳ Start | | String | - | | | ↳ End | | String | - | |
Output Ports5.1.9.4.5 - Waterfall ChartVisualize data as a waterfall chart Home > Visualization > Financial | Property | Requirement | Type | Default | Description |
|---|
| X Axis Values | ✓ | String | - | The column representing categories or stages | | Y Axis Values | ✓ | String | - | The column representing numeric values for each
stage |
Output Ports5.1.9.5 - MediaOperators in the Media category Home > Visualization > Media OperatorsTotal: 4 operators 5.1.9.5.1 - HTML VisualizerRender the result of HTML content Home > Visualization > Media | Property | Requirement | Type | Default | Description |
|---|
| HTML content | ✓ | String | - | |
Output Ports5.1.9.5.2 - Image VisualizerVisualize image content Home > Visualization > Media | Property | Requirement | Type | Default | Description |
|---|
| image content column | ✓ | String | - | The Binary data of the Image |
Output Ports5.1.9.5.3 - URL VisualizerRender the content of URL Home > Visualization > Media | Property | Requirement | Type | Default | Description |
|---|
| URL content | ✓ | String | - | |
Output Ports5.1.9.5.4 - Word CloudGenerate word cloud for texts Home > Visualization > Media | Property | Requirement | Type | Default | Description |
|---|
| Text column | ✓ | String | - | | | Number of most frequent words | | Integer | 100 | |
Output Ports5.1.9.6 - AdvancedOperators in the Advanced category Home > Visualization > Advanced Operators| Operator | Description |
|---|
| Choropleth Map | Visualize data using a Choropleth Map that uses shades of colors to show differences in properties or quantities between regions | | Scatter3D Chart | Visualize data in a Scatter3D Plot |
Total: 2 operators 5.1.9.6.1 - Choropleth MapVisualize data using a Choropleth Map that uses shades of colors to show differences in properties or quantities between regions Home > Visualization > Advanced | Property | Requirement | Type | Default | Description |
|---|
| Locations Column | ✓ | String | - | Column used to describe location. Currently only
supports countries and needs to be three-letter
ISO country code | | Color Column | ✓ | String (integer, long, double) | - | Column used to determine intensity of color of
the region |
Output Ports5.1.9.6.2 - Scatter3D ChartVisualize data in a Scatter3D Plot Home > Visualization > Advanced | Property | Requirement | Type | Default | Description |
|---|
| X Column | ✓ | String | - | Data column for the x-axis | | Y Column | ✓ | String | - | Data column for the y-axis | | Z Column | ✓ | String | - | Data column for the z-axis |
Output Ports5.1.9.7 - Nested TableVisualize Data in a Depth Two Nested Table Home > Visualization | Property | Requirement | Type | Default | Description |
|---|
| Add Attribute | ✓ | List | - | List of columns to include in the nested table
chart and their subgroup | | ↳ Attribute group | ✓ | String | - | | | ↳ Original attribute Name | ✓ | String | - | | | ↳ New Attribute Name | | String | - | |
Output Ports5.1.10 - Control BlockOperators in the Control Block category Home > Control Block Operators| Operator | Description |
|---|
| If | If | | Sleep | Sleep n seconds between each tuple |
Total: 2 operators 5.1.10.1 - IfIf Home > Control Block | Property | Requirement | Type | Default | Description |
|---|
| Condition State | ✓ | String | - | Name of the state variable to evaluate |
Output Ports5.1.10.2 - SleepSleep n seconds between each tuple Home > Control Block | Property | Requirement | Type | Default | Description |
|---|
| Sleep Time (seconds) | ✓ | Integer | 0 | |
Output Ports5.1.11 - Output Port ModesReference for operator output port modes Home Texera operators emit data through output ports. Each port advertises a mode that describes how downstream operators should interpret the stream of tuples it produces. Set SnapshotThe port re-emits the complete result set on each update. Downstream operators always see the full materialized result. Delta UpdatesThe port emits an incremental delta of the result set on each update. Downstream operators apply the delta on top of prior state instead of receiving a re-materialized snapshot. Single SnapshotThe port emits exactly one snapshot for the entire execution (not per update). Used for visualization operators whose output may exceed the memory limit, making repeated full-snapshot emission impractical. 5.1.12 - Parameter ReferenceComplete reference for machine learning operator parameters ← Home Available Parameter Sets5.1.12.1 - SklearnAdvancedKNN ParametersHyperparameters accepted by SklearnAdvancedKNN ← Parameters Index Used ByThis parameter set is used by the following operators: Parameters| Parameter | Type |
|---|
| n_neighbors | int | | p | int | | weights | str | | algorithm | str | | leaf_size | int | | metric | int | | metric_params | str |
5.1.12.2 - SklearnAdvancedSVC ParametersHyperparameters accepted by SklearnAdvancedSVC ← Parameters Index Used ByThis parameter set is used by the following operators: Parameters| Parameter | Type |
|---|
| C | float | | kernel | str | | gamma | float | | degree | int | | coef0 | float | | tol | float | | probability | (lambda value: value.lower() == "true") |
5.1.12.3 - SklearnAdvancedSVR ParametersHyperparameters accepted by SklearnAdvancedSVR ← Parameters Index Used ByThis parameter set is used by the following operators: Parameters| Parameter | Type |
|---|
| C | float | | kernel | str | | gamma | float | | degree | int | | coef0 | float | | tol | float | | shrinking | (lambda value: value.lower() == "true") | | verbose | (lambda value: value.lower() == "true") | | epsilon | float | | cache_size | int | | max_iter | int |
5.2 - EngineIn-depth technical and configuration references for Texera’s components and environment. 5.3 - FrontendIn-depth technical and configuration references for Texera’s components and environment. 5.4 - Project StructureIn-depth technical and configuration references for Texera’s components and environment. 5.5 - StorageIn-depth technical and configuration references for Texera’s components and environment. 5.6 - ConfigurationIn-depth technical and configuration references for Texera’s components and environment. 6 - Contribution GuidelinesHow to contribute to Texera code and documentation. Thank you for your interest in contributing to Texera! This guide explains how to contribute to both Texera’s codebase and documentation.
We follow a fork-based workflow and adopt the Conventional Commits standard for commit messages. Contributing to TexeraTexera welcomes contributions from everyone — whether you’re fixing a small bug, improving documentation, or adding new features.
👥 Roles in the Project| Role | Key Permissions | How to Join |
|---|
| Contributor | Submit issues & PRs, join discussions | Start contributing — no formal process | | Committer | Merge PRs, push code, vote on code changes | Nominated by PPMC based on quality contributions | | PPMC Member | Governance, release voting, new committer approvals | Voted by existing PPMC members | | Mentor | Guide project and ensure Apache compliance | Appointed by the Incubator PMC |
🛠 How to Contribute Code1. Fork the RepositoryFork the Texera repository on GitHub and clone it locally. 2. Find or Open an Issue- Pick an existing issue or create a new one describing your proposal or bug.
- Discuss your approach with committers before coding to reach consensus.
3. Create and Submit a Pull RequestDevelop in a new branch of your fork. Modifying the SQL schema?
Be sure to update sql/changelog.xml by adding a new <changeSet> element.
When ready, submit a PR to the main Texera repository. Allow edits from maintainers to let committers make small fixes if needed.
We use Conventional Commits: - Example PR titles:
feat: add new join operatorfix(ui): resolve workflow panel crashchore(deps): bump dependency versions
- The PR title becomes the final squashed commit message upon merge.
PR Description Should Include:- Purpose: use
Closes #1234 to auto-close an issue. - Summary: short overview of your changes.
- Optional: design document, technical diagram, or screenshots.
Avoid including: - Local config files (e.g.,
python_udf.conf) - Secrets or credentials
- Binary or build artifacts
🧪 Testing and Quality ChecksBackend (Scala)- Run lint:
sbt "scalafixAll --check"
- Run formatter:Fix with:
- Execute tests:
For IntelliJ users: ensure the working directory matches the module (amber for engine tests, core for services).
Frontend (Angular)- Run unit tests:
cd core/gui
ng test --watch=false
- Format code:
Write .spec.ts tests for new functionality to ensure future safety.
🔍 Pull Request Review Process- Request a committer to review your PR.
- Add labels (e.g.,
fix, enhancement, docs). - Wait for CI to pass (GitHub Actions).
- Mark your PR as draft if it’s not ready.
- Once approved, a committer will merge your PR.
All new files must include the Apache License header.
To automate this in IntelliJ: - Go to Settings → Editor → Copyright → Copyright Profiles.
- Create a profile named Apache and add:
Licensed to the Apache Software Foundation (ASF) under one
or more contributor license agreements. See the NOTICE file
distributed with this work for additional information
regarding copyright ownership...
- Set this as the default profile for the project.
✍️ Contributing to DocumentationTexera uses Hugo and the Docsy theme to build its website.
All documentation is stored in the Texera GitHub repository. Quick Steps- Click Edit this page at the top of any doc page to edit directly on GitHub.
- Make your edits and open a Pull Request.
- The site auto-deploys a preview for review via Netlify.
- Wait for approval and merge.
Preview LocallyTo preview locally: Visit http://localhost:1313 to view the site as you edit.
📚 Resources6.1 - Making ContributionsWe welcome interested developers to participate in the project and make contributions. - Follow the instructions at https://github.com/apache/texera/wiki/Installing-Texera-on-a-Single-Node to install Texera on your laptop using Docker. Get familiar with the system as a user.
- Follow the steps in https://github.com/apache/texera/wiki to get on board and raise a pull request PR). It will be reviewed by the team before it can be merged.
- Check issues in https://github.com/apache/texera/issues and see if you can fix some of them. Focus on the easy ones first.
After making enough contributions, you may be promoted to be a committer. If you prefer, we can also add you to our Slack workspace and invite you to join our meetings. 6.2 - Guide for Developers0. RequirementsJava 11 JDKInstall Java JDK 11 (Java Development Kit) (recommend: [adoptopenjdk](https://adoptium.net/installation/)). To verify the installation, run: Next, set JAVA_HOME. On macOS you can run: export JAVA_HOME=$(/usr/libexec/java_home -v 11)
On Windows, add a system environment variable called JAVA_HOME that points to the JDK directory. Install Python 3.12 (or 3.11/3.10) from the official site or your preferred package manager. GitOn Windows, install the software from https://gitforwindows.org/. Git Bash is available after installing Git. On Mac and Linux, see https://git-scm.com/book/en/v2/Getting-Started-Installing-Git Verify the installation by: Install sbt for building the project. Please refer to sbt Reference Manual — Installing sbt. We recommend you to use sdkman to install sbt. Verify the installation by: If the above command fails on Windows after installation, it is recommended to restart your computer. node LTS Version > 18.xInstall an LTS version (not the latest) of node. Currently, we require LTS version > 18.x. On Windows, install from https://nodejs.org/en/. On Mac and Linux, use NVM to install NodeJS as it avoids permission issues. Verify the installation by: Angular 16 CliInstall the angular 16 cli globally: npm install -g @angular/cli@16
Verify the installation by: 1. Setup Backend Development.In the terminal, clone the Texera repo: git clone git@github.com:Texera/texera.git
Do the following changes to the configuration files: - Edit
common/config/src/main/resources/storage.conf to use your Postgres credentials.
    jdbc {

-        username = "postgres"
+        username = <Postgres username you have>
        username = ${?STORAGE_JDBC_USERNAME}

-        password = "postgres"
+        password = <Postgres password you have>
        password = ${?STORAGE_JDBC_PASSWORD}
    }
- Edit
common/config/src/main/resources/udf.conf to use the correct python executable path(can be obtained by command which python or where python):
python {
-   path =
+   path = "/the/executable/path/of/python"
}
Setup PostgreSQL locallyTexera uses PostgreSQL to manage the user data and system metadata. To install and configure it:
Install Postgres. If you are using Mac, simply execute: Install Pgroonga for enabling full-text search, if you are using Mac, simply execute: Execute sql/texera_ddl.sql to create texera_db database for storing user system data & metadata storage psql -U postgres -f "sql/texera_ddl.sql"
Execute sql/iceberg_postgres_catalog.sql to create the database for storing Iceberg catalogs. psql -U postgres -f "sql/iceberg_postgres_catalog.sql"
Setup the LakeFS+Minio locallyTexera requires LakeFS and S3(Minio is one of the implementations) as the dataset storage. Setting up these two storage services locally are required to make Texera’s dataset feature functioning. Install Docker Desktop which contains both docker engine and docker compose. Make sure you launch the Docker after installing it. In the terminal, enter the directory containing the docker-compose file: cd file-service/src/main/resources
Edit docker-compose.yml by: search for volumes in the file and follow the instructions in the comment. This step is required otherwise your data will be lost if containers are deleted Execute the following command to start LakeFS and Minio: docker compose up
Import the project into IntelliJBefore you import the project, you need to have “Scala”, and “SBT Executor” plugins installed in Intellij.
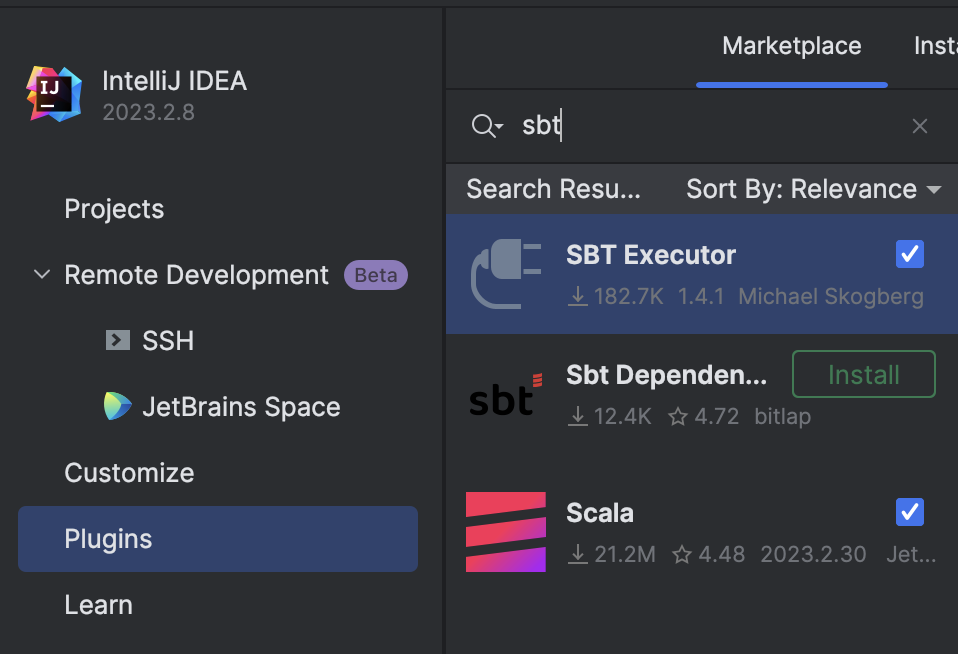 - In Intellij, open
File -> New -> Project From Existing Source, then choose the texera folder. - In the next window, select
Import Project from external model, then select sbt. - In the next window, make sure
Project JDK is set. Click OK. - IntelliJ should import and build this Scala project. In the terminal under
texera, run:
sbt clean protocGenerate
This will generate proto-specified codes. And the IntelliJ indexing should start. Wait until the indexing and importing is completed. And on the right, you can open the sbt tab and check the loaded texera project and couple of sub projects: 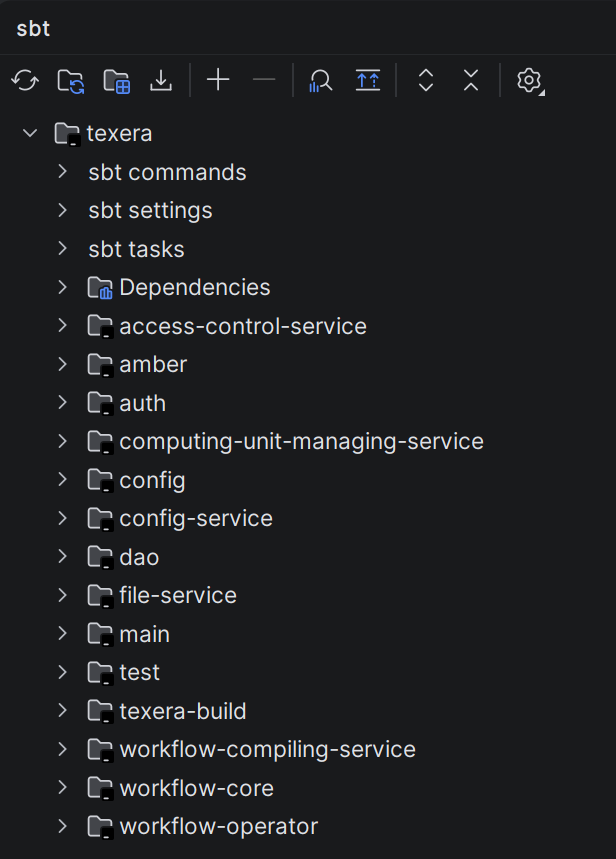 When IntelliJ prompts “Scalafmt configuration detected in this project” in the bottom right corner, select “Enable”.
If you missed the IntelliJ prompt, you can check the Event Log on the bottom right In addition to the microservices, you need to run the JOOQ code generation using sbt DAO/jooqGenerate, make sure to provide Postgres credentials.
Run the backend micro services in IntelliJThe easiest way to run backend services is in IntelliJ.
Currently we have couple of micro services for different purposes. If one microservice failed after running, it may have dependency to another microservice, so wait for other ones to start, also make sure to run LakeFS docker compose: | Component | File Path | Purpose / Functionality |
|---|
| ConfigService | config-service/src/main/scala/
org/apache/texera/service/
ConfigService.scala | Hosts the system configurations to allow the frontend to retrieve configuration data. | | TexeraWebApplication | amber/src/main/scala/
org/apache/texera/web/
TexeraWebApplication.scala | Provides user login, community resource read/write operations, and loads metadata for available operators. | | FileService | file-service/src/main/scala/
org/apache/texera/service/
FileService.scala | Provides dataset-related endpoints including dataset management, access control, and read/write operations across datasets. | | WorkflowCompilingService | workflow-compiling-service/src/main/scala/
org/apache/texera/service/
WorkflowCompilingService.scala | Propagates schema and checks for static errors during workflow construction. | | ComputingUnitMaster | amber/src/main/scala/
org/apache/texera/web/
ComputingUnitMaster.scala | Manages workflow execution and acts as the master node of the computing cluster.
Must start before ComputingUnitWorker. | | ComputingUnitWorker | amber/src/main/scala/
org/apache/texera/web/
ComputingUnitWorker.scala | A worker node in the computing cluster (not a web server). | | ComputingUnitManagingService | computing-unit-managing-service/src/main/scala/
org/apache/texera/service/
ComputingUnitManagingService.scala | Manages the lifecycle of different types of computing units and their connections to users’ frontends. | | AccessControlService | access-control-service/src/main/scala/
org/apache/texera/service/
AccessControlService.scala | Authorize requests sent to computing unit, currently not needed to run for local development, it is only used in Kubernetes setup. |
To run each of the above web service, go to the corresponding scala file(i.e. for TexeraWebApplication, go find TexeraWebApplication.scala), then run the main function by pressing on the green run button and wait for the process to start up. For TexeraWebApplication, the following message indicates that it is successfully running: [main] [akka.remote.Remoting] Remoting now listens on addresses:
org.eclipse.jetty.server.Server: Started
For ComputingUnitMaster, the following prompt indicates that it is successfully running: ---------Now we have 1 node in the cluster---------
Enable Python-based OperatorsTexera has lots of Python-based operators like visualizations, and UDF operators. To enable them, install python dependencies by executing, you also need to install R in your system: cd texera
pip install -r amber/requirements.txt -r amber/operator-requirements.txt
2. Launch Frontend
This is for developers that work on the frontend part of the project. This step is NOT needed if you develop the backend only.Before you start, make sure the backend services are all running. Install Angular CLIIgnore those warnings (warnings are usually marked in yellow color or start with WARN). Launch Frontend in IntelliJ for local development- Click on the Green Run button next to the
start in frontend/package.json. - Wait for some time and the server will get started. Open a browser and access
http://localhost:4200. You should see the Texera UI with a canvas.\
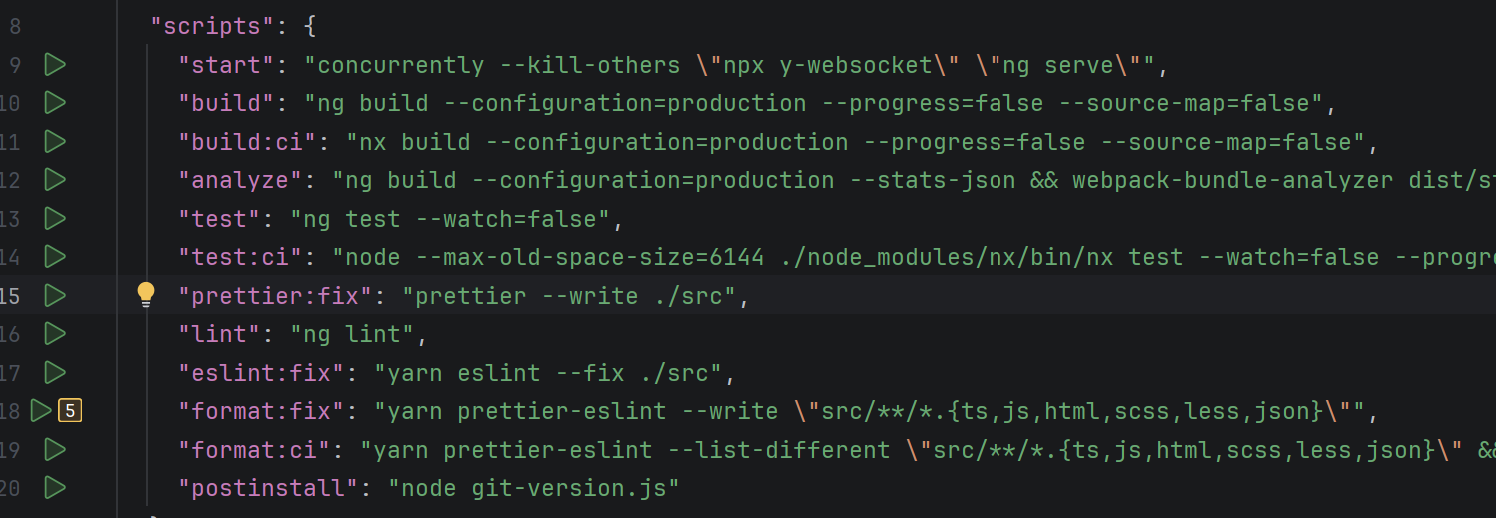 Every time you save the changes to the frontend code, the browser will automatically refresh to show the latest UI.
You can also run frontend using command line: Launch Frontend in the production environmentRun the following command yarn run build
This command will optimize the frontend code to make it run faster. This step will take a while. After that, start the backend engine in IntelliJ and use your browser to access http://localhost:8080. 3. Email Notification (Optional)
- Set
smtp in config/src/main/resources/user-system.conf. You need an App password if the account has 2FA. - Log in to Texera with an admin account.
- Open the Gmail dashboard under the admin tab.
- Send a test email.
4. Misc
This part is optional; you only need to do this if you are working on a specific task. To create a new database table and write queries using Java through Jooq- Create the needed new table in MySQL and update
sql/texera_ddl.sql to include the new table. - Run
sbt DAO/jooqGenerate to generate the classes for the new table.
Note: Jooq creates DAO for simple operations if the requested SQL query is complex, then the developer can use the generated Table classes to implement the operation Disable password loginEdit config/src/main/resources/gui.conf, change local-login to false. Enforce invite onlyEdit config/src/main/resources/user-system.conf, change invite-only to true. Backend endpoints Role AnnotationThere are two types of permissions for the backend endpoints: - @RolesAllowed(Array(“Role”))
- @PermitAll
Please don’t leave the permission setting blank. If the permission is missing for an endpoint, it will be @PermitAll by default.
Windows: enable long pathsSome workflows create deep directories (e.g., when writing metadata.json via Python/ICEBERG). On Windows, this can exceed the legacy MAX_PATH (~260 chars) and cause failures like: [WinError 3] The system cannot find the path specified.
Enable long paths support (per machine) by running PowerShell as Administrator: New-ItemProperty -Path "HKLM:\SYSTEM\CurrentControlSet\Control\FileSystem" -Name "LongPathsEnabled" -Value 1 -PropertyType DWORD -Force
Verify the setting (expected value: 1): Get-ItemProperty -Path "HKLM:\SYSTEM\CurrentControlSet\Control\FileSystem" -Name "LongPathsEnabled"
If you cannot change this policy (e.g., on managed devices), keep your workspace path short (e.g., C:\src\texera) to reduce overall path length.
Windows: Fix HADOOP_HOME errorsOn Windows, if you encounter the following error when executing a workflow: Caused by: java.io.FileNotFoundException: HADOOP_HOME and hadoop.home.dir are unset
here are the steps to solve this issue: Steps - Obtain a
winutils.exe matching your Hadoop line (Texera currently uses Hadoop 3.3.x). - Create the directory and place the binary:
C:\hadoop\bin\winutils.exe
- In IntelliJ, add this VM option to the FileService run configuration:
-Dhadoop.home.dir="C:\hadoop"
- (Optional) Also set a system environment variable and restart the IDE/terminal:
HADOOP_HOME=C:\hadoop
Notes - This issue may happen only on Windows; macOS/Linux do not need
winutils.exe. - Ensure the
winutils.exe you use matches your Hadoop major/minor (e.g., 3.3.x). - After configuring, the prior read/write and “unset” errors should disappear.
6.3 - Guide to Frontend Development (new gui)Author: Yinan Zhou Introduction:If you are new to Texera frontend development team or have little frontend experience using angular framework (version 6), this read intends to provide you with a simple guide of how to get started. Preparation phase:In a nutshell, angular provides modularity, scalability, and robustness to traditional frontend code design. It separates a website into different individual components that can each perform a certain level of independent tasks. It then connects different components with services so they can work collaboratively. It also provides unit testing at the component level as well as application level.
Other than these, angular largely inherits the traditional way of creating a web page. Each component contains four foundational files (.ts | .html | .css | spec.ts), corresponding to typescript (which is basically JavaScript with better scalability), HTML, CSS, and unit testing respectively. Just like how web pages were traditionally written, you will be coding in - html: the structure of the component
- css: the style of the component
- typescript: the content of the component
and additionally:
- unit tests: so that the component can be debugged in the future if it breaks
Don’t be overwhelmed. You don’t have to be a master in all these four fields to start working on texera frontend. If you have basic web development experience, you can jump to the next section to get started with learning angular. If you have no such experience, you should at least spend a few hours getting familiar with HTML, CSS, and JavaScript. The following links might be helpful. The following links are documentation and examples, don’t try to master all the knowledge from these websites at once, use them as dictionaries. They will be helpful when you start coding so don’t waste too much time on them now. Angular Tutorial Phase:At this point, you should at least be able to interpret an HTML/CSS/Typescript file with your own knowledge and the information you can find online. For the next few weeks, - go through the tutorial provided on the Angular official website, https://angular.io/guide/quickstart
- watch tutorial videos, (ask frontend group leader to share the videos with you on google drive)
- especially pay attention to the rxjs videos, you will need them a lot.
Although these tutorial videos are helpful, it can take a long time to finish watching them. Meanwhile, it is easy to forget what you have learned if you do not practice coding it. Therefore, I recommend you begin the next phase once you finish step 1. Frontend Code Base:At this point, you should know how to approach a simple angular application and interpret it using your own knowledge and the information you can find online. Download Visual Studio Code and relevant extensions, get access to Texera front-end code base (instructions can be found here). You should: - have a general understanding of the structure of the new-gui, what components are there? What do they do? What services are connecting them.
- You should have a feature in mind that you want to implement. Locate the component and services that are relevant to the feature you want to implement. Carefully read through the code in those sections, make sure you understand what is going on behind the scene.
- Start coding, then debug, and repeat. :)
- Look for solutions in the tutorial videos I mentioned in the previous phase step 2&3 when you have questions.
- Make good use of google, stack overflow, etc. However, be aware that a lot of code examples online can be outdated since we are using the most recent version of angular with rxjs.
useful tips that you should know how: - Right-click a variable/class/method name in the code base in visual studio code, then click “Peek Definition” or “Find All References”. It shows you how it was defined and where it has been used.
- Right-click web page and inspect elements
- You can Console.log(ThingsYouWantToInspect) in the code base; the logged information will appear in the console window after you do step 2.
Unit testing:Don’t worry about unit testing at the beginning. Finish the feature first and then write unit tests for it. 6.4 - Guide to Implement a Java Native OperatorIn this page, we’ll explain the basic concepts in Texera and use examples to show how to implement an operator. Code structure of every operator:Every operator ideally has three classes that are found in each operator package in core\workflow-operator\src\main\scala\edu\uci\ics\amber\operator - LogicalOp
- OperatorExecutor
- OperatorExecutorConfig
Basic concepts:A Texera user constructs a workflow using the frontend, which consists of many operators. Each operator take input data from its previous operator(s), does some computation, and outputs the results to the next operator(s). Suppose we have the following sample records, each of which has an ID and a tweet. id tweet
1 "today is a good day"
2 "weather is bad during the day"
Each row is called a Tuple, and each column is called a Field. // get the value of a field by column name
tuple1.getField("id") // result: 1
tuple1.getField("tweet") // result: "today is a good day"
// get the value by column index
tuple1.get(0) // result: 1
In this dataset, we have 2 columns, namely id of the integer type and tweet of the string type. This information is called a Schema.
A schema contains a list of attributes, and each attribute has a name (name of the column) and a type (data type of the column). schema = tuple.getSchema()
schema.getAttributes().get(0) // Attribute("id", AttributeType.Integer)
schema.getAttributes().get(1) // Attribute("tweet", AttributeType.String)
Example 1: Regular Expression (regex) operatorA regular expression operator matches a regular expression (regex) on each input tuple. For example, if we search the regex “weather” on the tweet attribute, then only tuple 2 will be the result. In other words, the regular expression operator is a kind of filter() operation in many programming languages. To implement a regular expression operator, you will first need to write an LogicalOp. The following code is part of class RegexOpDesc . class RegexOpDesc extends FilterOpDesc {
@JsonProperty(required = true)
@JsonSchemaTitle("attribute")
@JsonPropertyDescription("column to search regex on")
@AutofillAttributeName
var attribute: String = _
@JsonProperty(required = true)
@JsonSchemaTitle("regex")
@JsonPropertyDescription("regular expression")
var regex: String = _
@JsonProperty(required = false, defaultValue = "false")
@JsonSchemaTitle("Case Insensitive")
@JsonPropertyDescription("regex match is case sensitive")
var caseInsensitive: Boolean = _
}
The regular expression operator needs to take 3 properties from the user, namely attribute (the name of the column to search on), regex (the regular expression itself) and caseInsensitive (whether case sensitive for this regular expression). The @JsonProperty annotation will let the system know that this property needs to come from the user input, and it will automatically generate the corresponding input form in the frontend.
Inside @JsonProperty, required = true tells the frontend that this property is required from the user. The property also needs to provide a user-friendly title (inside @JsonSchemaTitle annotation) and a detailed description (inside @JsonPropertyDescription annotation). @AutofillAttributeName annotation tells the frontend to provide autocomplete on attribute name (name of the column). This operator descriptor also needs to provide information about this operator, including a user-friendly name, description, the group it belongs to, and number of input/output ports. override def operatorInfo: OperatorInfo =
OperatorInfo(
userFriendlyName = "Regular Expression",
operatorDescription = "Search a regular expression in a string column",
operatorGroupName = OperatorGroupConstants.SEARCH_GROUP,
numInputPorts = 1,
numOutputPorts = 1
)
Finally, the operator descriptor needs to specify its corresponding operator executor. An OperatorExecutor, or OpExec for short, contains the implementation of the processing logic in the operator. For the regular expression operator, it corresponds to RegexOpExec. The OpDesc supplies an OpExecInitInfo with a function that creates the corresponding operator executor () => new RegexOpExec(this). When creating a PhysicalOp (e.g., using oneToOnePhysicalOp in this case, which is one type of physical operator that should be used in most cases), the OpExecInitInfo is passed in for the PhysicalOp to use. PhysicalOp.oneToOnePhysicalOp(
executionId,
operatorIdentifier,
OpExecInitInfo(_ => new RegexOpExec(this))
)
The implementation of the regular expression operator executor is rather simple. Since this operator is doing a kind of filter() operation, it extends a pre-defined class FilterOpExec. It calls setFilterFunc to specify the filter function used by this operator: the matchRegex function. In matchRegex, we first get the string value of a column, and then test if the value matches the regex. class RegexOpExec(val opDesc: RegexOpDesc) extends FilterOpExec {
val pattern: Pattern = Pattern.compile(opDesc.regex)
this.setFilterFunc(this.matchRegex)
def matchRegex(tuple: Tuple): Boolean = {
val tupleValue = tuple.getField(opDesc.attribute).toString
return pattern.matcher(tupleValue).find
}
}
This operator needs to be registered to let the system know its existence. In the LogicalOp class, we need to add a new entry, which specifies its operator descriptor class and a unique operator name. @JsonSubTypes(
Array(
new Type(value = classOf[RegexOpDesc], name = "Regex"),
)
)
abstract class LogicalOp extends PortDescriptor with Serializable {
}
Now this operator will be automatically available in the frontend. We can now start the system and test this operator. To add an image for this operator, go to core/gui/src/assets/operator_images, then add an image with the SAME NAME as what’s specified in the operator registration. The image file should be in png format, with a transparent background, black and white, and should be square. For example, for the regex operator, the code new Type(value = classOf[RegexOpDesc], name = "Regex") specified a name Regex, then the image file name should be Regex.png. Summary: we have gone through the steps to implement a simple regular expression operator. This operator is a type of filter() operation. So it’s built on top of a set of pre-defined classes, FilterOpDesc, FilterOpExec, and FilterOpExecConfig. Example 2: Sentiment Analysis operatorA map() operation processes one input tuple and produces exactly one output tuple. Next, we’ll briefly explain the map() type of operators using the Sentiment Analysis operator as an example. The sentiment analysis operator uses the Stanford NLP package to analyze the sentiment of a text. Given the example dataset above, the output of this operator looks like this: id tweet sentiment
1 "today is a good day" "positive"
2 "weather is bad during the day" "negative"
The following code is the implementation of class SentimentAnalysisOpDesc in Java. public class SentimentAnalysisOpDesc extends MapOpDesc {
@JsonProperty(required = true)
@JsonSchemaTitle("attribute")
@JsonPropertyDescription("column to perform sentiment analysis on")
@AutofillAttributeName
public String attribute;
@JsonProperty(value = "result attribute", required = true, defaultValue = "sentiment")
@JsonPropertyDescription("column name of the sentiment analysis result")
public String resultAttribute;
@Override
public OneToOneOpExecConfig operatorExecutor() {
return new OneToOneOpExecConfig(operatorIdentifier(), () -> new SentimentAnalysisOpExec(this));
}
@Override
public OperatorInfo operatorInfo() {
return new OperatorInfo(
"Sentiment Analysis",
"analysis the sentiment of a text using machine learning",
OperatorGroupConstants.ANALYTICS_GROUP(),
1, 1
);
}
@Override
public Schema getOutputSchema(Schema[] schemas) {
if (resultAttribute == null || resultAttribute.trim().isEmpty()) {
return null;
}
return Schema.newBuilder().add(schemas[0]).add(resultAttribute, AttributeType.STRING).build();
}
}
You’ll notice that this operator implements a new function, getOutputSchema. This is because this operator adds a new column called sentiment. The function getOutputSchema returns the output schema produced by this operator given an input schema. In this implementation, resultAttribute is the new column name given by the user (default value is “sentiment”). If the value is empty, we return a null value to indicate that the output schema cannot be produced. The result schema includes all the attributes from the input schema, plus a new attribute of type string. The regular expression operator does not implement this function because a filter() operation does not add or remove any columns. The implementation of SentimentAnalysisOpExec extends MapOpExec and provides a map function. You can check the implementation in the codebase. Generic operationsIn Texera, currently we have 4 pre-defined operations you can extend. filter(): filters out any input tuple if it doesn’t satisfy a condition.map(): for each input tuple, transforms it to exactly one output tuple.flatmap(): for each input tuple, transforms it to a list of output tuples.aggregate(): performs an aggregation, such as sum, count, average, etc.
To implement an operator, you can first check if your operator can be implemented using the 4 pre-defined operations. You can find these pre-defined operations under texera/workflow/common/operators. Your own operator implementation should be in texera/workflow/operators/youroperator. Low-level OperatorExecutor APIFor more complicated operators, if they cannot be implemented using these operations, then you need to implement OperatorExecutor using the following low-level interface. trait IOperatorExecutor {
def open(): Unit
def close(): Unit
def processTuple(tuple: Either[ITuple, InputExhausted], input: Int): Iterator[ITuple]
}
The open() and close() functions allow you to initialize and dispose any resources (such as opened files), respectively. They will be called once before and after the whole execution by the engine. The important function is processTuple, which implements the processing logic inside the operator. The processTuple function takes two parameters: tuple and input. Since an operator can have multiple input ports, and each input port can have multiple input operators connected to (e.g., Union), input: Int indicates which input port the current tuple is coming from. The parameter tuple is either a Tuple type or an InputExhausted type, indicating all data from an input operator has been exhausted. It returns an Iterator[Tuple], which means zero or more output tuples can be produced following this input. processTuple will be called whenever a new input tuple arrives, and called once if the input is exhausted. When an input port is connected to multiple input operators, this InputExhausted will be processed multiple times (once per input operator). General content:Texera’s backend is responsible for determining the UI information to the frontend. After receiving the information, the frontend efficiently translates and presents the content. Input Box 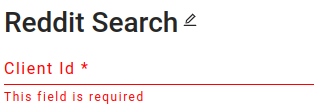
Here is an example of a user input box, with the name “Client Id” and its description. @JsonProperty(required=true)
@JsonSchemaTitle("Client Id")
@JsonPropertyDescription("Client id that uses to access Reddit API")
var clientId: String = _
Multiple selection 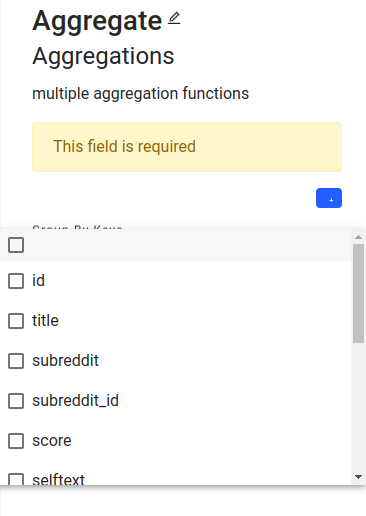
Here is an example of a multiple selection in the aggregate operator. @JsonProperty(value = "attribute", required = true)
@JsonPropertyDescription("column to calculate average value")
@AutofillAttributeName
var attribute: String = _
In the backend, we assign the attribute name list to fill the selections. Since it is multiselection, the type needs to be a list. Checkbox 
For the checkbox, we assign the data type to boolean. Here is an example in pythonUDF operator. By setting the data type to boolean, we successfully implement it as a checkbox. @JsonProperty(required = true, defaultValue = "true")
@JsonSchemaTitle("Retain input columns")
@JsonPropertyDescription("Keep the original input columns?")
var retainInputColumns: Boolean = Boolean.box(false)
List 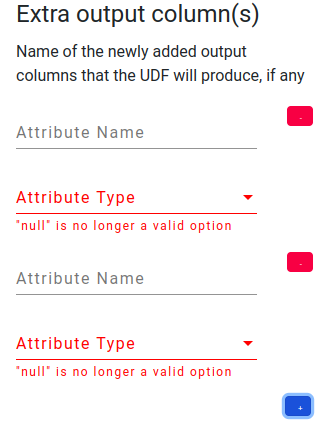
In pythonUDF operator, there is an example of a list, which is for the output schema. By clicking the blue button, we can add one more pair of attribute information. And the red button will delete such attribute information. In the backend, we have a list to hold the attribute values. @JsonProperty
@JsonSchemaTitle("Extra output column(s)")
@JsonPropertyDescription(
"Name of the newly added output columns that the UDF will produce, if any"
)
var outputColumns: List[Attribute] = List()
Registration and iconIn the file amber/src/main/scala/edu/uci/ics/texera/workflow/common/operators/LogicalOp.scala, you will find a list of all registered operators, complete with their descriptor classes and names. After adding an operator’s information, you can assign an icon to it. All operator icons are stored in the /core/new-gui/src/assets/operator_images directory. It’s essential to ensure that the icon filename matches its respective operator descriptor name. 6.5 - Guide to Implement a Python Native Operator (converting from a Python UDF)In the page for PythonUDF, we introduced the basic concepts of PythonUDF and described each API. To let other users use the Python operators, it is necessary to implement it as a native operator. In this section, we will discuss how to implement a Python native operator and let future users drag and drop it on the UI. We will start by implementing a sample UDF then talk about how to convert it to a native operator. Starting with a Sample Python UDFSuppose we have a sample Python UDF named Treemap Visualizer, as presented below: 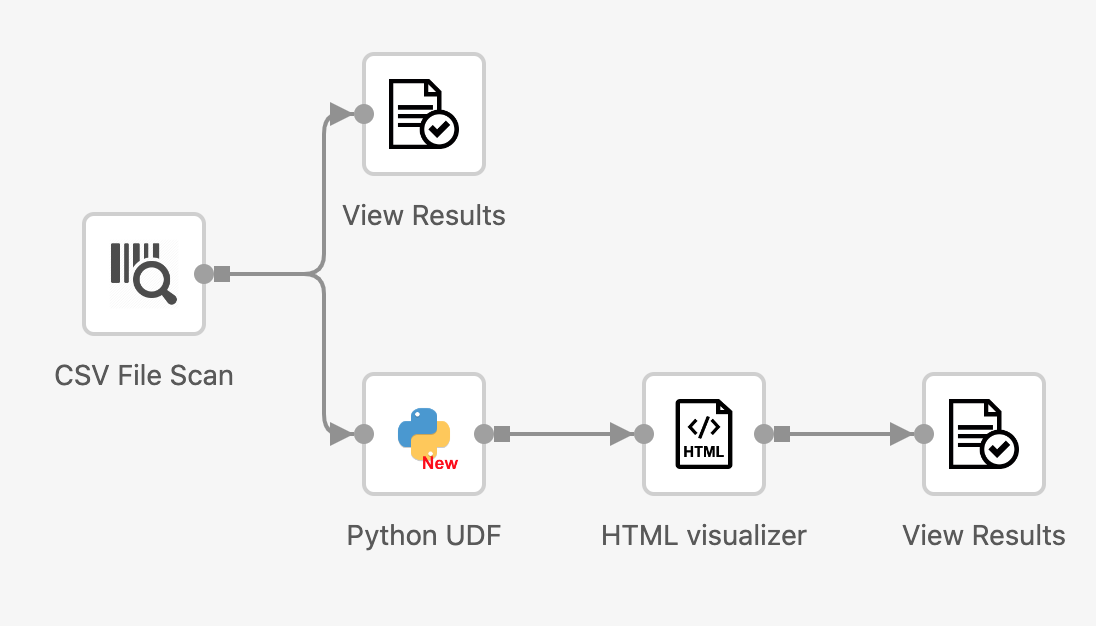 The UDF takes a CSV file as its input. For this example, we use a dataset of geo-location information of tweets. A sample of the dataset is shown below: 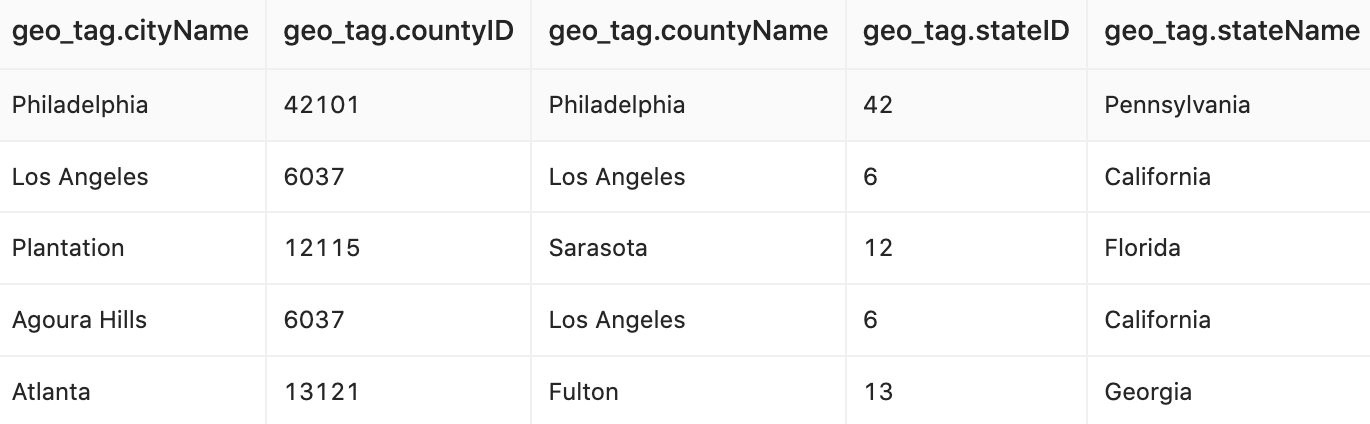 The Treemap Visualizer UDF takes the CSV file as a table (using the Table API) and outputs an HTML page that contains a treemap figure. The HTML page will be consumed by the HTML visualizer operator, and the View Result operator eventually displays the figure in the browser. The visualization is presented below: 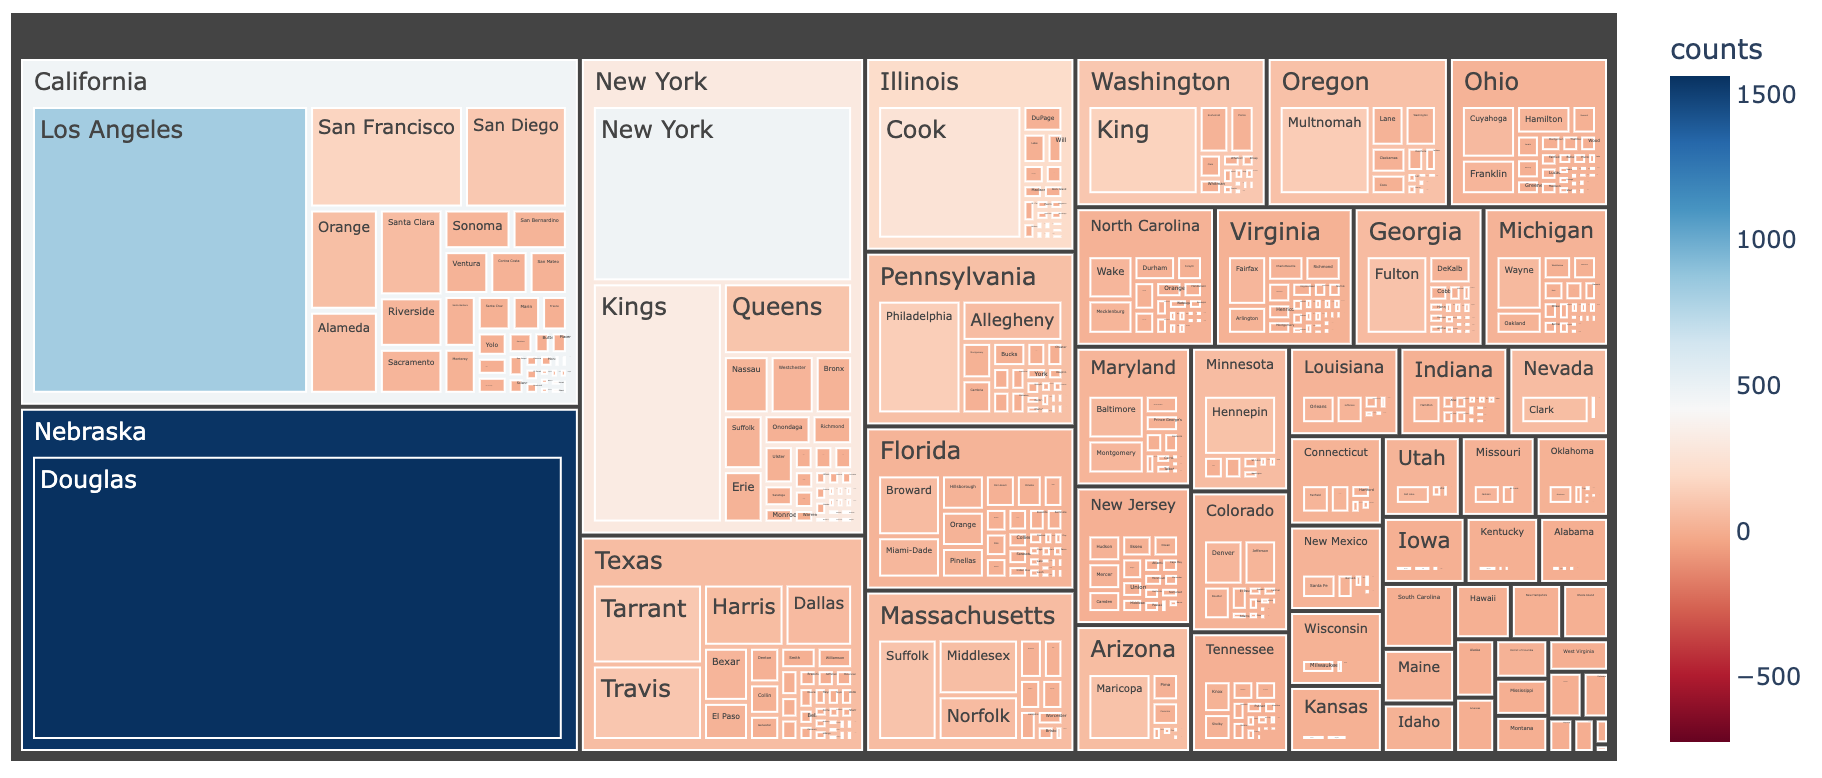 Now, let’s take a closer look at the Treemap Visualizer UDF.
As shown in the following code block, the UDF contains 3 steps: from pytexera import *
import plotly.express as px
import plotly.io
import plotly
import numpy as np
class ProcessTableOperator(UDFTableOperator):
@overrides
def process_table(self, table: Table, port: int) -> Iterator[Optional[TableLike]]:
table = table.groupby(['geo_tag.countyName','geo_tag.stateName']).size().reset_index(name='counts')
#print(table)
fig = px.treemap(table, path=['geo_tag.stateName','geo_tag.countyName'], values='counts',
color='counts', hover_data=['geo_tag.countyName','geo_tag.stateName'],
color_continuous_scale='RdBu',
color_continuous_midpoint=np.average(table['counts'], weights=table['counts']))
fig.update_layout(margin=dict(t=50, l=25, r=25, b=25))
html = plotly.io.to_html(fig, include_plotlyjs='cdn', auto_play=False)
yield {'html': html}
- It first performs an aggregation with a groupby to calculate the number of geo_tags of each US state.
- Then it invokes the Plotly library to create a treemap figure based on the aggregated dataset.
- Lastly, it converts the treemap figure object into an HTML string, by invoking the
to_html function in the Plotly library, and yields it as the output.
Convert the UDF into a Python Native OperatorNext we convert the Treemap Visualizer UDF into a native operator.
As described in thepage for Java native operator, a native operator requires the definitions of a descriptor (Desc), an executor (Exec), and a configuration (OpConfig). A Python native operator also requires these definitions, with some unique tweaks. We use the Treemap Visualization operator as an example to elaborate the differences: Operator Descriptor (Desc)Operator infomation
The operator information is the same as a Java native operator, which contains the name, description, group, input port, and output port information. Extending interface
Instead of implementing the OperatorDescriptor interface, a Python native operator implements the PythonOperatorDescriptor interface with overriding the generatePythonCode method. Our example is a VisualizationOperator, and we need to extend it as well. Python content
The generatePythonCode method returns the actual Python code as a string, as shown below: 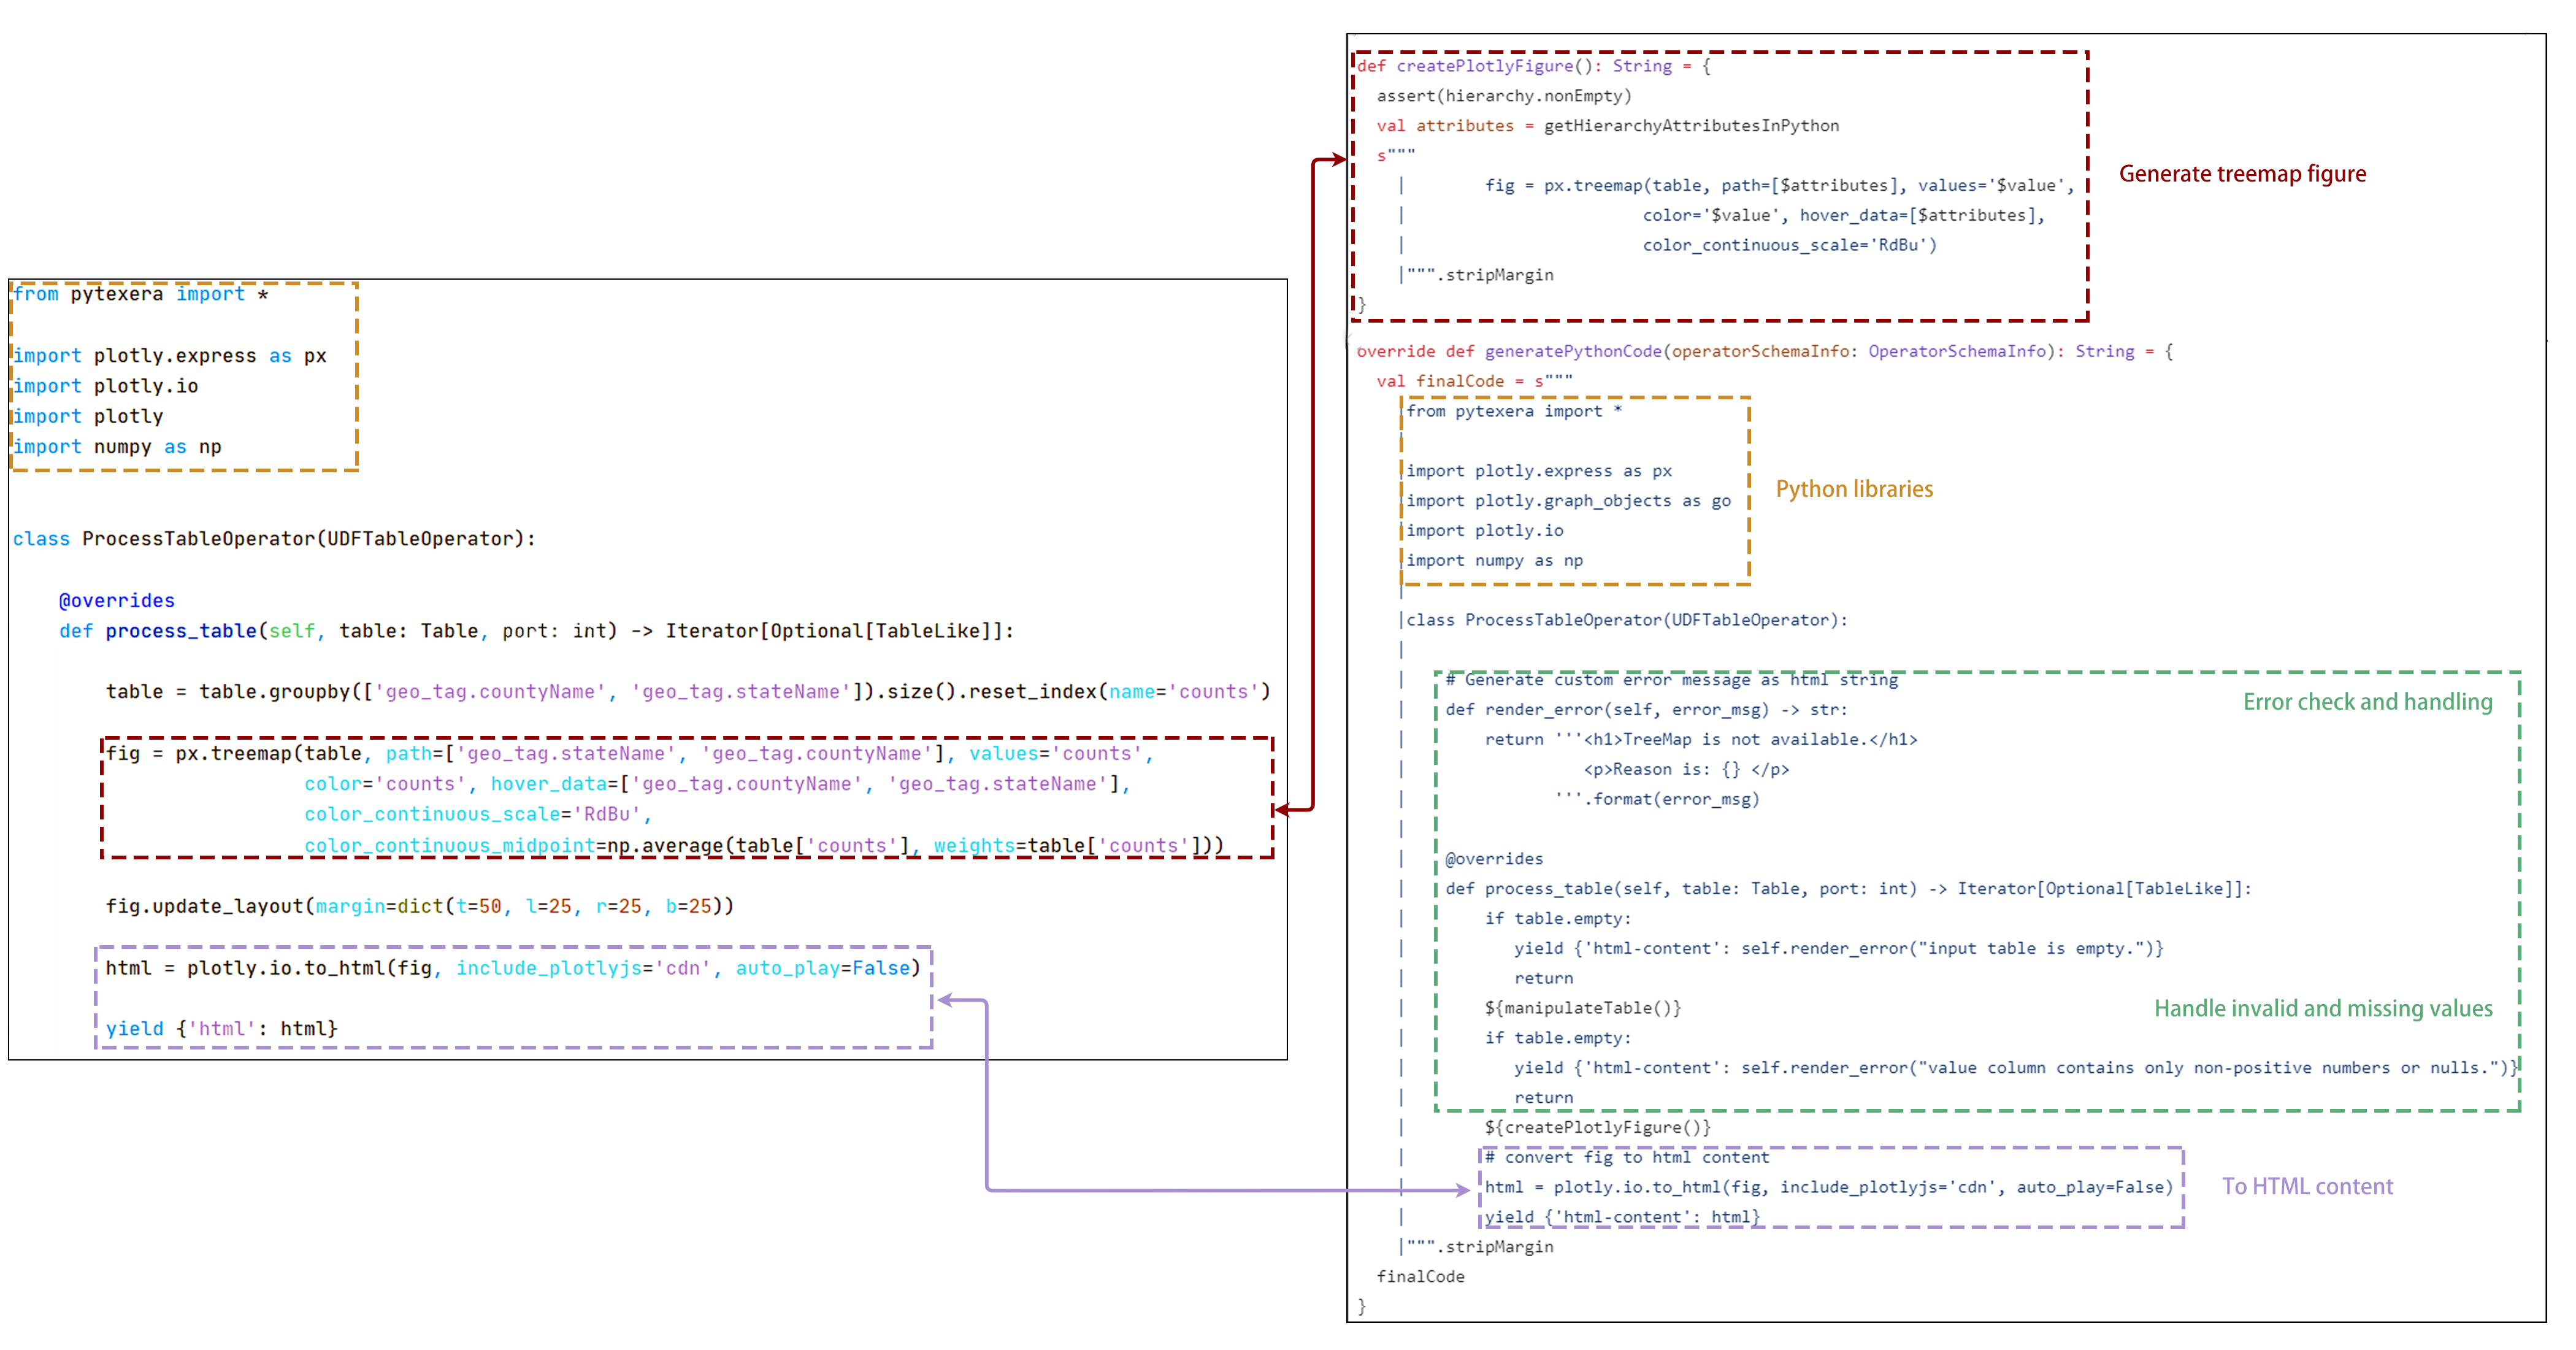
Now, let’s compare the code in the PythonUDF with what we write in the descriptor. As we can see, both are responsible for generating the treemap figure and converting it into an HTML page. Additionally, we’ve included null-value handling and error alerts to make the operator more comprehensive. Output schema
The Python UDF needs to define the output Schema in the property editor, while for native operators the output Schema is defined by implementing getOutputSchema. To do so, we use a Schema builder and add the output schema with the attribute name “html-content”. override def getOutputSchema(schemas: Array[Schema]): Schema = {
Schema.newBuilder.add(new Attribute("html-content", AttributeType.STRING)).build
}
Chart type
Since this operator is a visualization operator, we need to register its chart type as a HTML_VIZ. override def chartType(): String = VisualizationConstants.HTML_VIZ
Executor (Exec)In all Python native operators, the executor is simply the PythonUDFExecutor. Operator ConfigurationIn a Python native operator, it shares the same configuration as a Java native operator. RegistrationIt has the same process as a Java native operator. TestAfter following all the steps above, you should be able to drag and drop the operator into the canvas. During the execution, the operator will output the expected result. 6.6 - Build, Run and Configure micro‐services in local development environmentThis Document is aim to provide a instruction on how to setup the local development environment for developing and deploying the core/micro-services. PrerequisiteThis document requires you to finish all the setup of Texera local development environment described in https://github.com/Texera/texera/wiki. What is micro-services?core/micro-services is a sbt-managed project added by the PR https://github.com/Texera/texera/pull/2922. The ongoing code separation effort will gradually migrate all the services in core/amber to core/micro-services.
How to directly build and run the micro-services directlyIf you just want to run some services under micro-services, you can use some provided shell scripts. WorkflowCompilingService
cd texera/core

# make sure to give scripts the execution permission
chmod +x scripts/build-workflow-compiling-service.sh
chmod +x scripts/workflow-compiling-service.sh

# Build the WorkflowCompilingService
scripts/build-workflow-compiling-service.sh

# Run the WorkflowCompilingService
scripts/workflow-compiling-service.sh
How to set up the development environmentAs there are many sub sbt projects under micro-services, Intellij is the most suitable IDE for setting up the whole environment Use Intellij (Most Recommended)- Open the folder
texera/core/micro-services through Open Project in Intellij
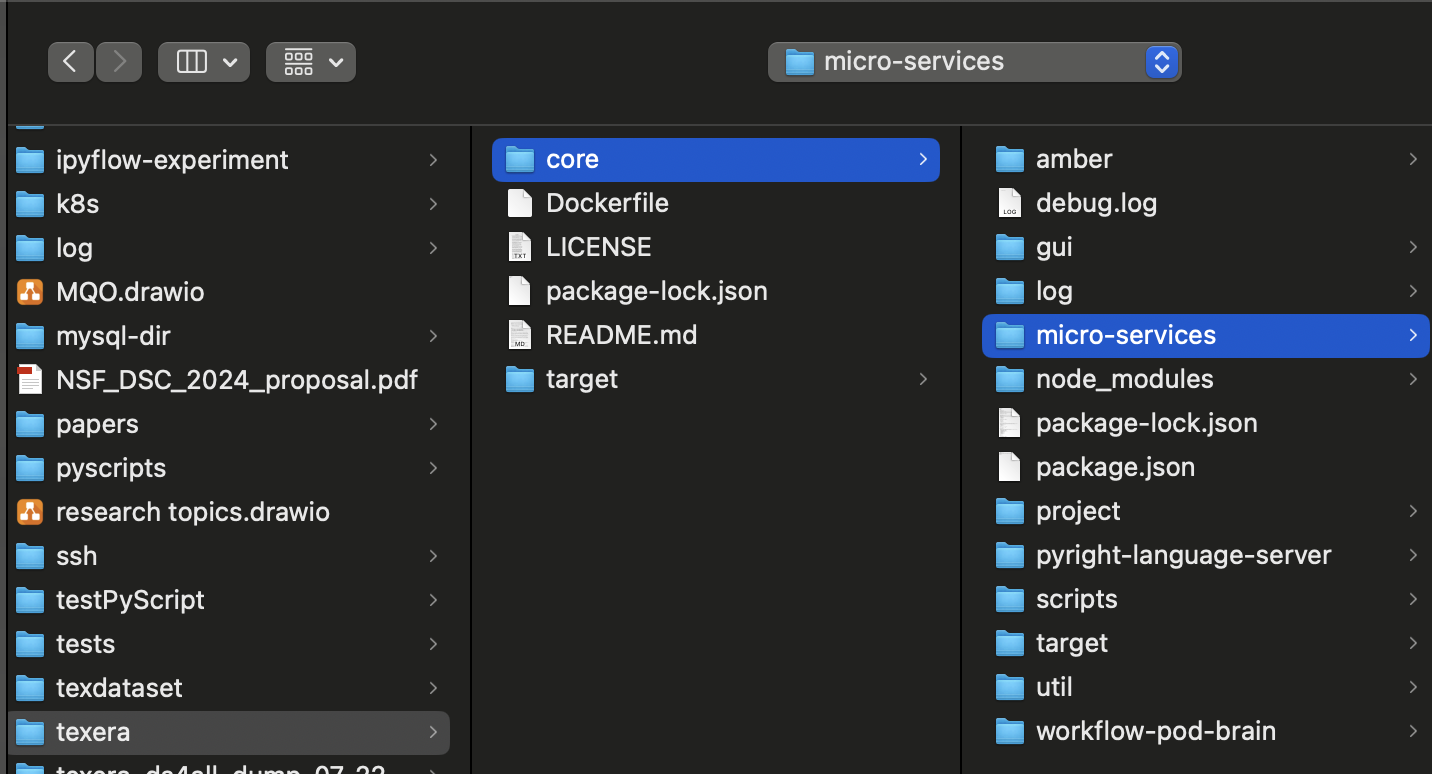
Once you open it, Intellij will auto-detect the sbt setting and start to load the project. After loading you should see the sbt tab, which has the micro-services as the root project and several other services as the sub-projects:
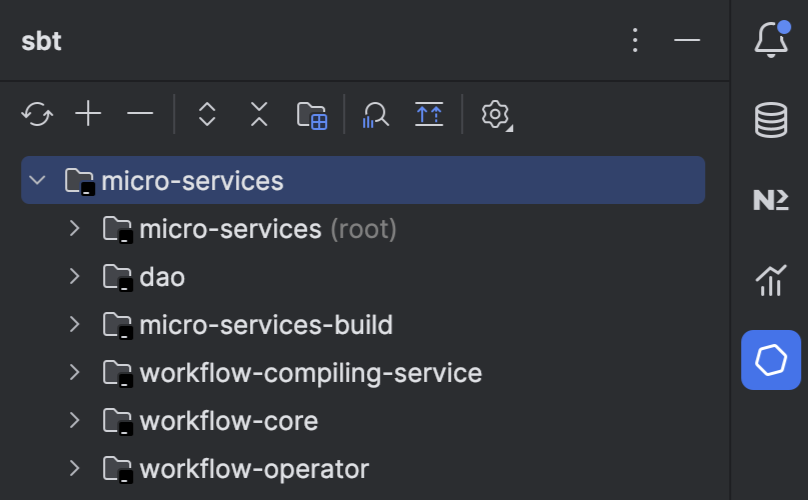 - Run
sbt clean compile command in folder core/micro-services. This command will compile everything under micro-services and generate proto-specified codes.
6.7 - Apache License headerEvery file must include the Apache License as a header. This can be automated in IntelliJ by
adding a Copyright profile: Go to “Settings” → “Editor” → “Copyright” → “Copyright Profiles”. Add a new profile and name it “Apache”. Add the following text as the license text: Licensed to the Apache Software Foundation (ASF) under one
or more contributor license agreements. See the NOTICE file
distributed with this work for additional information
regarding copyright ownership. The ASF licenses this file
to you under the Apache License, Version 2.0 (the
"License"); you may not use this file except in compliance
with the License. You may obtain a copy of the License at
http://www.apache.org/licenses/LICENSE-2.0
Unless required by applicable law or agreed to in writing, software
distributed under the License is distributed on an "AS IS" BASIS,
WITHOUT WARRANTIES OR CONDITIONS OF ANY KIND, either express or implied.
See the License for the specific language governing permissions and
limitations under the License.
Go to “Editor” → “Copyright” and choose the “Apache” profile as the default profile for this
project. Click “Apply”.
6.8 - [VOTE] Release Apache Texera (incubating) Email TemplateSubject: [VOTE] Release Apache Texera (incubating) ${VERSION} RC${RC_NUM} Hi Texera Community, This is a call for vote to release Apache Texera (incubating) ${VERSION}. == Release Candidate Artifacts == The release candidate artifacts can be found at:
https://dist.apache.org/repos/dist/dev/incubator/texera/${RC_DIR}/ The artifacts include: - apache-texera-${VERSION}-rc${RC_NUM}-src.tar.gz (source tarball)
- apache-texera-${VERSION}-rc${RC_NUM}-src.tar.gz.asc (GPG signature)
- apache-texera-${VERSION}-rc${RC_NUM}-src.tar.gz.sha512 (SHA512 checksum)
== Git Tag == The Git tag for this release candidate:
https://github.com/apache/incubator-texera/releases/tag/${TAG_NAME} The commit hash for this tag:
${COMMIT_HASH} == Release Notes == Release notes can be found at:
https://github.com/apache/incubator-texera/releases/tag/${TAG_NAME} == Keys == The artifacts have been signed with Key [${GPG_KEY_ID}], corresponding to [${GPG_EMAIL}]. The KEYS file containing the public keys can be found at:
https://dist.apache.org/repos/dist/dev/incubator/texera/KEYS == How to Verify == Download the release artifacts: wget https://dist.apache.org/repos/dist/dev/incubator/texera/${RC_DIR}/apache-texera-${VERSION}-rc${RC_NUM}-src.tar.gz
wget https://dist.apache.org/repos/dist/dev/incubator/texera/${RC_DIR}/apache-texera-${VERSION}-rc${RC_NUM}-src.tar.gz.asc
wget https://dist.apache.org/repos/dist/dev/incubator/texera/${RC_DIR}/apache-texera-${VERSION}-rc${RC_NUM}-src.tar.gz.sha512 Import the KEYS file and verify the GPG signature: wget https://dist.apache.org/repos/dist/dev/incubator/texera/KEYS
gpg –import KEYS
gpg –verify apache-texera-${VERSION}-rc${RC_NUM}-src.tar.gz.asc apache-texera-${VERSION}-rc${RC_NUM}-src.tar.gz Verify the SHA512 checksum: sha512sum -c apache-texera-${VERSION}-rc${RC_NUM}-src.tar.gz.sha512 Extract and build from source: tar -xzf apache-texera-${VERSION}-rc${RC_NUM}-src.tar.gz
cd apache-texera-${VERSION}-rc${RC_NUM}-src Follow build instructions in README
== How to Vote == The vote will be open for at least 72 hours. Please vote accordingly: [ ] +1 Approve the release
[ ] 0 No opinion
[ ] -1 Disapprove the release (please provide the reason) == Checklist for Reference == When reviewing, please check: [ ] Download links are valid
[ ] Checksums and PGP signatures are valid
[ ] LICENSE and NOTICE files are correct
[ ] All files have ASF license headers where appropriate
[ ] No unexpected binary files
[ ] Source tarball matches the Git tag
[ ] Can compile from source successfully Thanks,
[Your Name]
Apache Texera (incubating) PPMC 7 - SecurityComprehensive guide to Texera’s security model, user roles, access control, and vulnerability reporting This page provides comprehensive information about Texera’s security model, including authentication mechanisms, authorization policies, user roles, resource access control, and guidelines for reporting security vulnerabilities. Understanding these security features is essential for deployment managers and users to ensure secure operation of Texera installations. Table of ContentsSecurity Model OverviewTexera’s security architecture is built around: - Authentication: JWT-based token authentication with configurable expiration
- Authorization: Role-based access control (RBAC) with four user roles
- Resource Access Control: Fine-grained privileges for datasets, workflows, and computing units
- Deployment Isolation: Separate security considerations for different deployment modes
Resources in TexeraIn Texera, a resource is any object within the system that can be created, accessed, modified, or shared by users
via the web application. Understanding resource types and how access to them is managed is critical to following
Texera’s security model. Resource TypesTexera supports the following resource types: - Datasets: Input data imported or uploaded for workflow processing
- Workflows: Data analytics pipelines defined by users
- Computing Units: Execution environments for running workflows (e.g., Kubernates PODs)
- Results: Output from workflow executions, including but not limited to data, logs, metrics, and visualizations
Resource Ownership and Access ControlEvery resource is owned by a user. The owner controls the resource’s visibility and can share it with other users by
granting access permissions: - READ: View the resource and its contents
- WRITE: Modify, execute, delete, and share the resource
- NONE: No access to the resource
Resources can be shared with specific users or made public. Public resources are visible to all users. Resource owners
can modify access permissions at any time. Resource Visibility- Users can only see resources for which they have at least READ access.
- Access changes (e.g., revoking WRITE or READ) take effect immediately for affected users.
User Categories and ResponsibilitiesTexera’s security model distinguishes between two categories of users with distinct responsibilities: Deployment ManagersThey have the highest level of access and control. They install and configure Texera, and make decisions about
technologies, deployment modes, and permissions. They can potentially delete the entire installation and have access to
all credentials, including database passwords, JWT secrets, and API keys. Deployment managers have full access to: - The underlying infrastructure (servers, Kubernetes clusters, cloud resources)
- Database administration (e.g., PostgreSQL)
- All configuration files, environment variables, and secrets
- Network and security settings
- Container orchestration and system logs
Deployment managers can also decide to keep audits, backups, and copies of information outside of Texera, which are not
covered by Texera’s security model. They operate outside the Texera UI role system and may or may not have a UI user
account. UI UsersWho They Are: Individuals who interact with Texera through the web interface. Access Level: Application-level access only. UI users work within the Texera platform but do not have access to: - The underlying infrastructure (servers, Kubernetes cluster)
- Database administration
- System configuration files
- Network and firewall settings
- Container orchestration
Roles: UI users are assigned one of four roles (INACTIVE, RESTRICTED, REGULAR, ADMIN) that control their permissions
within the Texera application. Security Scope: UI users are responsible for: - Protecting their login credentials
- Managing access to their resources, e.g., datasets and workflows
- Following organizational data security policies
UI User Roles and PrivilegesTexera implements four UI user roles with increasing levels of privilege. These roles control what users can do within
the Texera web application and do not grant infrastructure-level access. 1. INACTIVEUsers with this role cannot log in to the system or access any resources. This is the default role for new registrations
awaiting approval in controlled environments. 2. RESTRICTEDUsers with this role cannot log in to the system or access any resources. Unlike INACTIVE users, RESTRICTED accounts
typically represent users who previously used Texera but are now inactive and no longer use it. Any resources they
created in the past remain in the system but are inaccessible to them. This role is used to preserve historical data
while preventing further access. 3. REGULARUsers with this role can create and manage their own resources (datasets, workflows, computing units). They have full
READ and WRITE access to resources they own, and their access to other users’ resources is determined by granted
permissions (see Resources section above). They cannot: - Access other users’ private resources without granted permissions
- Manage user accounts or change user roles
- Access system configuration, logs, or global settings
This is the standard role for data scientists, analysts, and researchers.
Note: REGULAR users can execute arbitrary code within workflows, so this role should only be granted to trusted
individuals. 4. ADMINUsers with this role are application administrators who manage users and resources through the web interface. They have all REGULAR privileges, plus: - Manage all UI user accounts (create, modify, and delete users)
- Change user roles
- View user login information.
- Configure application settings available in the web interface
They cannot: - Access the underlying servers or Kubernetes cluster
- Modify JWT secrets or database passwords
- Configure HTTPS/TLS or network settings
- Access system-level logs or SSH into servers
Note: ADMIN is an application-level role, not an infrastructure administrator. For infrastructure management,
deployment manager access is required. Deployments and Computing UnitsTexera can be deployed in several configurations, such as local development, single-node setups, or distributed Kubernetes
clusters. For details on supported deployment options and their operational differences, see the deployment guides in
our wiki. Computing Unit TypesTexera executes workflows on computing units. UI users (REGULAR and ADMIN) can execute arbitrary code (e.g., through
UDFs written in Python, R, Scala) within computing units as part of their workflows. This code is currently not
sandboxed or restricted by Texera. Deployment managers configure which types of computing units are available: Local Computing UnitsLocal computing units run as processes on the same machine as the Texera services (single-node deployment). Security characteristics: - Suitable for development, testing, and small team use
- All computing units share the same host machine
- No infrastructure-level isolation between users’ workflows
- Deployment managers control all computing resources
Security considerations: - Users’ workflow code executes on the host machine with limited isolation
- Deployment managers must trust all REGULAR and ADMIN users
- Resource exhaustion by one user can affect all users
Kubernetes Computing UnitsKubernetes computing units run as separate PODs in a Kubernetes cluster. Each computing unit is dynamically created when
a user needs it. Security characteristics: - Suitable for production environments and multi-tenant deployments
- Each computing unit runs in an isolated Kubernetes pod
- UI users configure resource limits (CPU, memory, GPU) per pod
- Pods can be scheduled across multiple nodes for better resource distribution
Security considerations: - Better isolation between users compared to local computing units
- Kubernetes provides namespace and pod-level isolation
- Resource limits prevent individual users from consuming excessive resources
- Container security and image scanning should be implemented
- Deployment managers must secure the Kubernetes cluster infrastructure
What is NOT GuaranteedTexera’s security model does NOT guarantee: - Protection against malicious code in user workflows (users can execute arbitrary code)
- Strong isolation between workflows in local computing units
- Complete isolation between workflows in Kubernetes computing units within the same namespace
- Protection against infrastructure-level compromises
- Protection against deployment manager misconfigurations
- DDoS protection (requires external infrastructure)
- Compliance with specific regulatory requirements without additional configuration
What is NOT a Security IssueThese are things that we are well aware of, and have been reported to us many times, but we do not class as a security vulnerability. Please do not report them. Issues not classed as security relevant: - A lack of DMARC or SPF record on our domains
- “Clickjacking” on our domains
- Directory listings. These are deliberate and do not contain sensitive information
- Systems that disclose the versions of the servers and software we use
- Data that is publically accessible in our Jira bug tracking system
Reporting Security VulnerabilitiesWe strongly encourage you to report potential security vulnerabilities to one of our private security mailing lists first, before disclosing them in a public forum. A list of security contacts for Apache projects is available. If you can’t find a project-specific security e-mail address and you have an undisclosed security vulnerability to report, use the general security address below. Only use the security contacts to report undisclosed security vulnerabilities in Apache projects and manage the process of fixing such vulnerabilities. We cannot accept regular bug reports or other security-related queries at these addresses. We will ignore mail sent to these addresses that does not relate to an undisclosed security problem in an Apache project. Also note that the security team handles vulnerabilities in Apache projects, not running ASF services. Send reports of vulnerabilities in ASF services to root@apache.org. (This includes issues with apache.org websites) The general security mailing list address is: security@apache.org. This is a private mailing list. Please send one plain-text, unencrypted, email for each vulnerability you are reporting. We may ask you to resubmit your report if you send it as an image, movie, HTML, or PDF attachment when you could as easily describe it with plain text. 8 - ExamplesExplore example workflows and applications built with Texera. This section showcases example workflows, use cases, and demonstrations to help you understand Texera in action. Texera makes it easy to design and execute data analytics workflows visually.
Here, you’ll find a collection of example workflows that highlight Texera’s capabilities — from data ingestion and transformation to visualization and machine learning.
🧩 Example WorkflowsEach example demonstrates how Texera operators can be combined to solve different types of data problems. Text Analytics Workflow
Analyze text data using tokenization, keyword extraction, and word cloud visualization.
→ See the Text Analytics Example Join and Filter Workflow
Combine multiple datasets using joins and filters to create complex data pipelines.
→ See the Join Operator Example Machine Learning Workflow
Build end-to-end ML workflows with data preprocessing, model training, and evaluation operators.
→ See the Machine Learning Example Visualization Workflow
Explore Texera’s interactive visual operators like scatter plots, histograms, and word clouds.
→ See the Visualization Example
💡 How to Run the ExamplesTo try these examples on your local Texera instance: - Launch Texera following the Getting Started guide.
- Open the Workflow Editor in your browser at
http://localhost:4200. - Import an example workflow file (
.json) from the Texera Example Repository. - Run the workflow to see Texera’s operators and data visualizations in action.
🧠 Want to Contribute an Example?If you’ve built your own workflow and want to share it:
These examples are a great starting point for learning Texera’s visual programming model and understanding how different operators interact to form powerful data pipelines. |